Grade 7 Exam > Grade 7 Notes > Social Studies for Grade 7 > Chapter Notes: Supply and Demand
Supply and Demand Chapter Notes | Social Studies for Grade 7 PDF Download

Introduction
Supply and demand are important ideas in economics that help us understand how things are bought and sold. Supply is about how much of something, like toys or apples, is available. Demand is about how much people want to buy those things. These ideas show us why prices go up or down and how businesses decide what to make. In this chapter, we will learn about quantities, curves, and what happens when there is too much or too little of something.
Understand Quantity Supplied and Quantity Demanded
- Quantity Supplied is the amount of a product that sellers are ready to sell at a certain price.
- Factors affecting quantity supplied:
- Price of the product: If the price is high, sellers want to sell more.
- Cost of making the product: If it costs less to make, sellers can offer more.
- Technology: Better technology can help make more products.
- Number of sellers: More sellers mean more products are available.
- Quantity Demanded is the amount of a product that buyers want to buy at a certain price.
- Factors affecting quantity demanded:
- Price of the product: If the price is low, people want to buy more.
- Income: If people have more money, they may buy more.
- Tastes and preferences: If people like a product, they demand more.
- Prices of related goods: If similar products are cheaper, people may buy those instead.
Understand Overall Supply and Demand
- Supply is the total amount of a product that all sellers are willing to sell at different prices.
- Supply characteristics:
- When prices go up, supply usually increases because sellers want to earn more.
- When prices go down, supply decreases because it’s less profitable.
- Demand is the total amount of a product that all buyers want to buy at different prices.
- Demand characteristics:
- When prices go down, demand usually increases because people can afford more.
- When prices go up, demand decreases because fewer people want to buy.
- Supply and demand work together to set the price of a product in the market.
- Equilibrium is when the quantity supplied equals the quantity demanded at a certain price.
- At equilibrium:
- The market is balanced.
- There is no extra product or shortage.
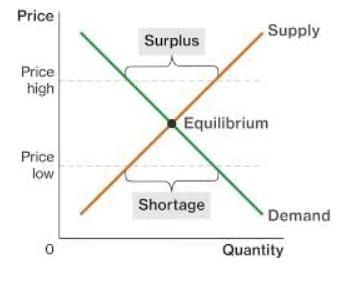
Create and Use Supply and Demand Curves
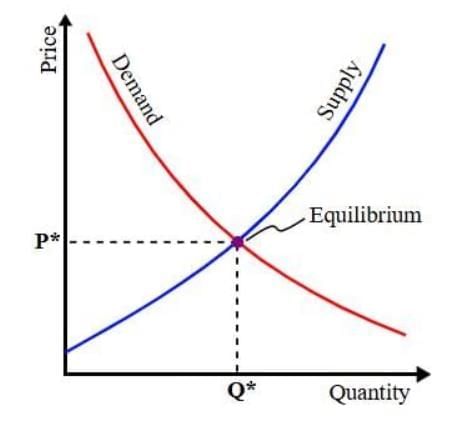
- A supply curve is a graph showing how much of a product sellers will offer at different prices.
- Features of a supply curve:
- It slopes upward from left to right.
- Higher prices mean more supply, shown higher on the graph.
- A demand curve is a graph showing how much of a product buyers want at different prices.
- Features of a demand curve:
- It slopes downward from left to right.
- Lower prices mean more demand, shown higher on the quantity axis.
- How to create supply and demand curves:
- Collect data on prices and quantities for supply and demand.
- Plot prices on the vertical axis (y-axis) and quantities on the horizontal axis (x-axis).
- Draw the supply curve going up and the demand curve going down.
- The point where the two curves meet is the equilibrium price and quantity.
- Uses of supply and demand curves:
- Show how prices affect supply and demand.
- Find the equilibrium price where supply equals demand.
- Predict what happens if prices or other factors change.
Identify Shortage and Surplus
- A shortage happens when the quantity demanded is more than the quantity supplied.
- Causes of a shortage:
- Price is too low, so more people want to buy than there is product available.
- Sudden increase in demand, like during holidays.
- Decrease in supply, like if a factory stops making the product.
- A surplus happens when the quantity supplied is more than the quantity demanded.
- Causes of a surplus:
- Price is too high, so fewer people want to buy.
- Sudden decrease in demand, like if a product becomes less popular.
- Increase in supply, like if more sellers start making the product.
- Shortages may cause prices to go up because people compete to buy the product.
- Surpluses may cause prices to go down because sellers want to sell extra products.
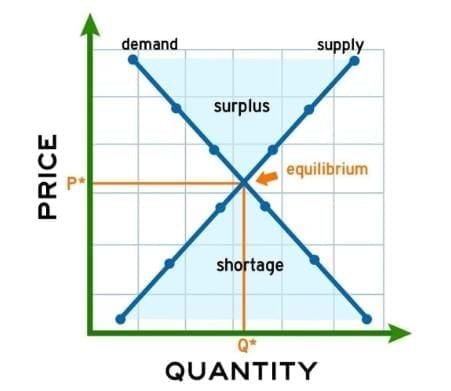
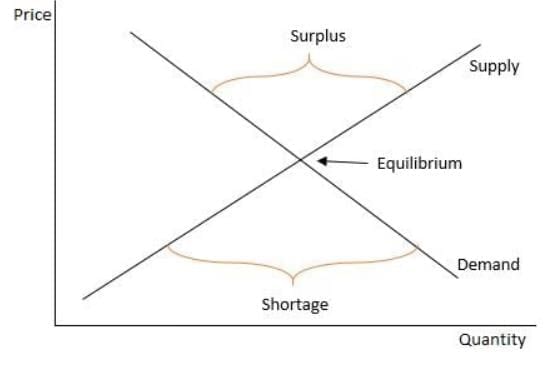
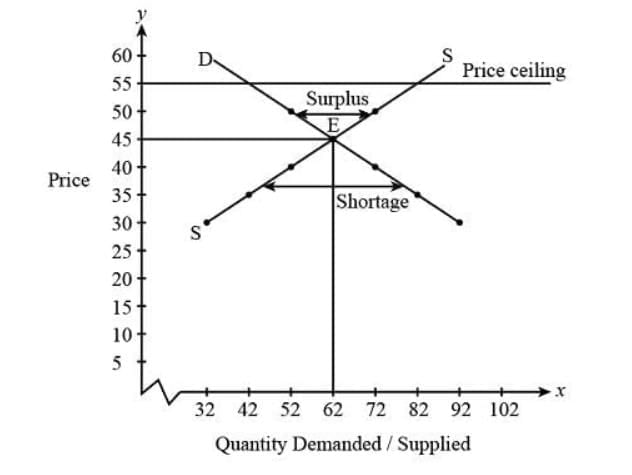
Identify Shortage and Surplus with Graphs
- On a supply and demand graph, a shortage is shown when the quantity demanded is greater than the quantity supplied at a certain price.
- How to identify a shortage on a graph:
- Find the price on the y-axis.
- Look at the demand curve to see the quantity demanded at that price.
- Look at the supply curve to see the quantity supplied at that price.
- If the quantity demanded is more than the quantity supplied, there is a shortage.
- The shortage is the difference between the two quantities.
- On a supply and demand graph, a surplus is shown when the quantity supplied is greater than the quantity demanded at a certain price.
- How to identify a surplus on a graph:
- Find the price on the y-axis.
- Look at the supply curve to see the quantity supplied at that price.
- Look at the demand curve to see the quantity demanded at that price.
- If the quantity supplied is more than the quantity demanded, there is a surplus.
- The surplus is the difference between the two quantities.
- The equilibrium point on the graph shows no shortage or surplus because supply equals demand.
Identify Shortage and Surplus with Data
- Shortage with data means the number of items people want to buy is more than the number available at a certain price.
- How to identify a shortage with data:
- Look at the price of the product.
- Check the quantity demanded at that price (how many people want to buy).
- Check the quantity supplied at that price (how many items are available).
- If the quantity demanded is higher than the quantity supplied, there is a shortage.
- Calculate the shortage by subtracting the quantity supplied from the quantity demanded.
- Surplus with data means the number of items available is more than the number people want to buy at a certain price.
- How to identify a surplus with data:
- Look at the price of the product.
- Check the quantity supplied at that price (how many items are available).
- Check the quantity demanded at that price (how many people want to buy).
- If the quantity supplied is higher than the quantity demanded, there is a surplus.
- Calculate the surplus by subtracting the quantity demanded from the quantity supplied.
- Data helps businesses know if they need to change prices to balance supply and demand.
The document Supply and Demand Chapter Notes | Social Studies for Grade 7 is a part of the Grade 7 Course Social Studies for Grade 7.
All you need of Grade 7 at this link: Grade 7
FAQs on Supply and Demand Chapter Notes - Social Studies for Grade 7
| 1. What is the difference between quantity supplied and quantity demanded? |  |
Ans.Quantity supplied refers to the amount of a product that producers are willing and able to sell at a given price, while quantity demanded is the amount of a product that consumers are willing and able to purchase at that same price. The relationship between these two concepts is fundamental to understanding market dynamics.
| 2. How do supply and demand curves work? | |
Ans.Supply and demand curves are graphical representations that show the relationship between the price of a good and the quantity supplied or demanded. The supply curve typically slopes upward, indicating that as prices increase, suppliers are willing to produce more. Conversely, the demand curve slopes downward, showing that as prices decrease, consumers are willing to buy more.
| 3. What is a shortage and how is it identified on a graph? | |
Ans.A shortage occurs when the quantity demanded exceeds the quantity supplied at a given price. On a graph, this is illustrated where the demand curve is above the supply curve. The area between the two curves at that price level represents the shortage.
| 4. What happens during a surplus in a market? | |
Ans.A surplus occurs when the quantity supplied exceeds the quantity demanded at a certain price. This can be identified on a graph where the supply curve is above the demand curve. In this situation, producers may lower prices to encourage sales and reduce the excess supply.
| 5. How can data be used to identify shortages and surpluses? | |
Ans.Data can be used to identify shortages and surpluses by comparing the quantities supplied and demanded at various price points. If the quantity demanded is consistently higher than the quantity supplied, a shortage exists. Conversely, if the quantity supplied is greater than the quantity demanded, a surplus is present. Analyzing trends in this data over time can provide insights into market conditions.
About this Document

Sep 03, 2025
Last updated
Related Exams
Document Description: Chapter Notes: Supply and Demand for Grade 7 2025 is part of Social Studies for Grade 7 preparation.
The notes and questions for Chapter Notes: Supply and Demand have been prepared according to the Grade 7 exam syllabus. Information about Chapter Notes: Supply and Demand covers topics
like Introduction, Understand Quantity Supplied and Quantity Demanded, Understand Overall Supply and Demand, Create and Use Supply and Demand Curves, Identify Shortage and Surplus, Identify Shortage and Surplus with Graphs, Identify Shortage and Surplus with Data and Chapter Notes: Supply and Demand Example, for Grade 7 2025 Exam. Find important definitions, questions, notes, meanings, examples, exercises and tests below for Chapter Notes: Supply and Demand.
Introduction of Chapter Notes: Supply and Demand in English is available as part of our Social Studies for Grade 7
for Grade 7 & Chapter Notes: Supply and Demand in Hindi for Social Studies for Grade 7 course.
Download more important topics related with notes, lectures and mock test series for Grade 7
Exam by signing up for free. Grade 7: Supply and Demand Chapter Notes | Social Studies for Grade 7
Description
Full syllabus notes, lecture & questions for Supply and Demand Chapter Notes | Social Studies for Grade 7 - Grade 7 | Plus excerises question with solution to help you revise complete syllabus for Social Studies for Grade 7 | Best notes, free PDF download
Information about Chapter Notes: Supply and Demand
In this doc you can find the meaning of Chapter Notes: Supply and Demand defined & explained in the simplest way possible. Besides explaining types of
Chapter Notes: Supply and Demand theory, EduRev gives you an ample number of questions to practice Chapter Notes: Supply and Demand tests, examples and also practice Grade 7
tests

Related Searches
Extra Questions
,ppt
,Summary
,Important questions
,Previous Year Questions with Solutions
,Exam
,Supply and Demand Chapter Notes | Social Studies for Grade 7
,mock tests for examination
,Sample Paper
,study material
,Supply and Demand Chapter Notes | Social Studies for Grade 7
,video lectures
,Objective type Questions
,MCQs
,shortcuts and tricks
,Supply and Demand Chapter Notes | Social Studies for Grade 7
,practice quizzes
,Viva Questions
,past year papers
,Semester Notes
,Free
;


Additional Information about Chapter Notes: Supply and Demand for Grade 7 Preparation
Chapter Notes: Supply and Demand Free PDF Download
The Chapter Notes: Supply and Demand is an invaluable resource that delves deep into the core of the Grade 7 exam.
These study notes are curated by experts and cover all the essential topics and concepts, making your preparation more efficient and effective.
With the help of these notes, you can grasp complex subjects quickly, revise important points easily,
and reinforce your understanding of key concepts. The study notes are presented in a concise and easy-to-understand manner,
allowing you to optimize your learning process. Whether you're looking for best-recommended books, sample papers, study material,
or toppers' notes, this PDF has got you covered. Download the Chapter Notes: Supply and Demand now and kickstart your journey towards success in the Grade 7 exam.
Importance of Chapter Notes: Supply and Demand
The importance of Chapter Notes: Supply and Demand cannot be overstated, especially for Grade 7 aspirants.
This document holds the key to success in the Grade 7 exam.
It offers a detailed understanding of the concept, providing invaluable insights into the topic.
By knowing the concepts well in advance, students can plan their preparation effectively.
Utilize this indispensable guide for a well-rounded preparation and achieve your desired results.
Chapter Notes: Supply and Demand
Chapter Notes: Supply and Demand Notes offer in-depth insights into the specific topic to help you master it with ease.
This comprehensive document covers all aspects related to Chapter Notes: Supply and Demand.
It includes detailed information about the exam syllabus, recommended books, and study materials for a well-rounded preparation.
Practice papers and question papers enable you to assess your progress effectively.
Additionally, the paper analysis provides valuable tips for tackling the exam strategically.
Access to Toppers' notes gives you an edge in understanding complex concepts.
Whether you're a beginner or aiming for advanced proficiency, Chapter Notes: Supply and Demand Notes on EduRev are your ultimate resource for success.
Chapter Notes: Supply and Demand Grade 7 Questions
The "Chapter Notes: Supply and Demand Grade 7 Questions" guide is a valuable resource for all aspiring students preparing for the
Grade 7 exam. It focuses on providing a wide range of practice questions to help students gauge
their understanding of the exam topics. These questions cover the entire syllabus, ensuring comprehensive preparation.
The guide includes previous years' question papers for students to familiarize themselves with the exam's format and difficulty level.
Additionally, it offers subject-specific question banks, allowing students to focus on weak areas and improve their performance.
Study Chapter Notes: Supply and Demand on the App
Students of Grade 7 can study Chapter Notes: Supply and Demand alongwith tests & analysis from the EduRev app,
which will help them while preparing for their exam. Apart from the Chapter Notes: Supply and Demand,
students can also utilize the EduRev App for other study materials such as previous year question papers, syllabus, important questions, etc.
The EduRev App will make your learning easier as you can access it from anywhere you want.
The content of Chapter Notes: Supply and Demand is prepared as per the latest Grade 7 syllabus.
|
© EduRev
|
Education Revolution
|


|


Signup to see your scores
go up
within 7 days!
within 7 days!
Takes less than 10 seconds to signup