Class 8 Exam > Class 8 Notes > Geography Class 8 ICSE > Chapter Notes: Representation of Geographical Features
Representation of Geographical Features Chapter Notes | Geography Class 8 ICSE PDF Download
| Table of contents |
|
| Introduction |
|
| Topographic Maps |
|
| Contour |
|
| Mapping Landforms through Contours |
|
| Settlements |
|
| Interpretation of Topographical Sheets |
|

Introduction
This chapter explores the representation of geographical features on topographic maps, building on the knowledge gained in Classes 6 and 7. It focuses on understanding and interpreting the various features of topographic sheets, which are large-scale maps that depict the Earth's surface using symbols and contour lines. These maps provide crucial information about the land's topography, including natural features like mountains, valleys, and plains, as well as man-made features like roads and dams. The chapter also covers the characteristics of contour lines, types of slopes, landforms, settlements, and the interpretation of topographical sheets, offering a comprehensive understanding of how to read and analyze these maps.
Topographic Maps
- Topographic maps are large-scale maps showing the Earth's surface features using symbols.
- They depict natural features (mountains, plateaus, plains) and man-made features (dams, roads).
- Elevation is shown in feet or metres, indicating height above sea level.
- Contour lines connect points of equal elevation to represent landforms, slopes, and relief:
- Elevation is the height of a place above sea level, ranging from a few metres to thousands of metres.
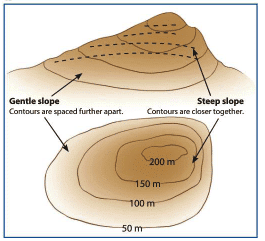
- Slope indicates how steep the land is; closely spaced contour lines show steep slopes, while sparsely spaced lines indicate flat land.
- Relief is the difference between the highest and lowest elevations in an area.
Contour
- Contour lines are found only on large-scale topographic maps.
- Index contours are bold lines with elevation marked, often occurring every fifth contour line.
- Intermediate contours lie between index contours, e.g., five intermediate contours between 300m and 400m with a 20m interval.
- Contour interval is the altitude difference between two successive contour lines.
- Distance between contour lines indicates the type of slope:
- Closely grouped contours show a steep slope.
- Spaced-out contours indicate a gradual slope.
- Evenly spaced contours represent a uniform slope.
- Widely spaced contours suggest a gentle slope.
- Widely spaced contours at a hilltop indicate a flat hilltop.
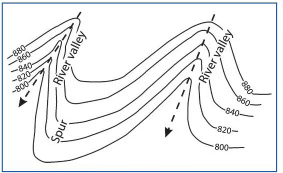
- Contour lines form a 'V' shape along valleys, pointing upstream to show stream flow direction.
- Streams flow downhill, and contours can cross streams.
- Contour lines never touch or cross, except in vertical cliffs where they appear stacked.
- Stacked contours indicate a cliff.
Mapping Landforms through Contours
- Topographic maps use symbols to represent natural landforms.
- Understanding contour patterns helps identify landforms like slopes, hills, plateaus, ridges, saddles, passes, and cols.
Slopes
- Slope is the rate of ascent or descent of the ground.
- Closer contour lines indicate steeper slopes; farther apart lines show gentler slopes:
- Gentle slope: Evenly spaced, widely apart contour lines.
- Steep slope: Evenly spaced, closely placed contour lines.
Hill
- A hill is an area of high ground with slopes descending in all directions.
- Shown by a single closed contour line or concentric closed contour lines.
- The smallest closed circle represents the hilltop.
- More contour lines indicate a higher hill.
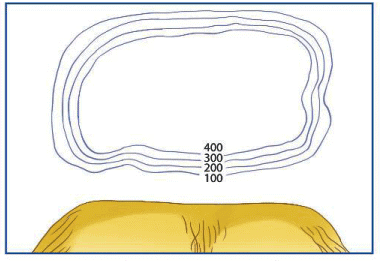
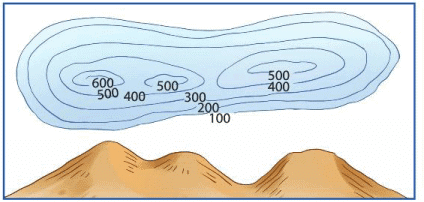
Plateaus
- Plateaus are broad highlands with flat tops, rising abruptly from surrounding land.
- Depicted by evenly spaced contour lines surrounding an area with few or no lines, indicating a flat top.
Ridge
- A ridge is a narrow, elongated range of hills with a sharp crest and multiple peaks.
- Slopes are steep-sided, shown by elongated or oval, closely spaced contour lines.
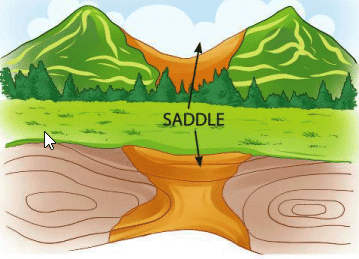
Saddle
- A saddle is a low point between two areas of higher ground, not always between hilltops.
- Contour lines form an hourglass or figure-eight shape.
- The depression is broad and low, resembling a horse’s saddle.
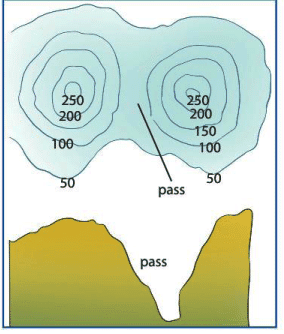
Passes
- Passes are low points or openings between peaks in a mountain or hill range.
- Provide passage across mountains, shown as empty spaces between two closed contour lines representing peaks.
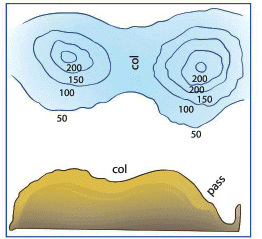
Col
- A col is the lowest point on a mountain ridge between two peaks, also called a notch or gap.
- It is narrow and steep-sided, unlike a broader saddle.
Gap
- A gap is a low-lying area between two elevated landmasses, like mountains.
- More rugged and harder to navigate than passes, e.g., the South Col between Mount Everest and Lhotse.
Settlements
- Settlements are places where people establish residential communities, varying from single dwellings to large cities.
- Can be temporary (occupied briefly) or permanent (occupied for a long time).
- Other types include holiday resorts, markets, towns, ports, and industrial towns, classified by their main functions.
Classification of Settlements
- Rural settlements rely on primary activities like agriculture, animal husbandry, and fishing.
- Characteristics include water supply, fertile lands, relief features, building materials, and scattered populations.
- Urban settlements are larger, with people engaged in secondary (manufacturing) or tertiary (trading, services) activities.
- Urban infrastructure includes concrete buildings, bridges, roads, and developed transport systems.
Patterns of Rural Settlements
- Dispersed settlements: Houses are far apart, often interspersed with fields, with centralized markets.
- Compact or nucleated settlements: Houses are built close together, common in fertile plain regions.
- Linear settlements: Constructed along roads, railways, rivers, canals, valley edges, or levees.
- Radial settlements: Houses spread out from a central point along streets in all directions.
Interpretation of Topographical Sheets
Topographical sheets are interpreted under five main heads: marginal information, relief features and drainage, prominent land uses, means of transport and communication, and human settlements.Marginal Information
- Name of the topographical sheet.
- Number of the topographical sheet.
- Area shown on the sheet.
- Area covered in square kilometres.
- Latitudinal and longitudinal extent.
- Extent of the grid.
- Scale of the topographical sheet.
- Special information, if any.
Relief Features and Drainage
- Contour intervals on the sheet.
- Physical divisions on the sheet.
- Description of relief features in each physical division.
- Major landforms and their locations.
- Drainage pattern.
- Prominent water bodies.
- General slope of the area.
- Gradient and direction of important rivers.
Prominent Land Uses
- Types of natural vegetation.
- Distribution patterns of natural vegetation.
- Major types of possible land uses.
- Main occupations, such as lumbering, livestock raising, farming, mining, and industries.
Means of Transport and Communication
- Transport and communication means shown on the sheet, like tracks, footpaths, roads, railways, telegraph, telephone lines, and post offices.
- Correlation between topography and transport/communication means.
Human Settlements
- Urban and rural centres, their size, and location.
- Settlement patterns.
- Special activities in urban centres, such as industries, mining, trading, administrative, and defence.
- Density and pattern of rural settlements.
- Information on land use and major occupations.
Profile of Survey Map 45 D/7
- Description of the area covered by Survey Sheet No. 45 D/7 (Gujarat and Rajasthan).
- Districts: Banaskantha (Gujarat) and Sirohi (Rajasthan).
- Location: Latitude 24°20' North, Longitude 72°25' East.
- Region lies in western India, on the borders of Rajasthan and Gujarat, at the southern end of the Aravalli Hills, northeast of Sheet 45 D/10.
Relief
- Area is mainly flat, except for the east-central region where hills rise to nearly 500 metres.
- Lower hills in the northeast corner.
- Land slopes from northeast to southwest in the northern half and east to west in the southern half, indicated by river flow.
Drainage
- Banas River flows westward into the swampland of the Little Rann, northeast of the Gulf of Kutch.
- Has numerous smaller streams, with the Balaram Nadi as a left-bank tributary from the southeast.
- River width varies from 0.25 km to over 1 km, with a narrow perennial watercourse.
- Dry portions fill during the rainy season.
Natural Vegetation
- Hilly areas: Dry deciduous forests of small trees
- Plains: Shrubs and thorny trees where there is no agriculture
- Irrigation: Region dependent on the periodic rainfall (monsoon), tanks and wells for agriculture
- Occupations: Agriculture and rearing of cattle, sheep, camels and horses
- Communication: Except for the main line of the Western Railway and the road that runs across the south-east corner of the map through Chitrasani, there are no other important communication links. All the other settlements are linked by cart tracks.
- Settlements: Except for Chitrasani which is a rail/road centre, all the settlements are small and widely scattered chiefly in the lowland area and are either in a nucleated or dispersed pattern.
The document Representation of Geographical Features Chapter Notes | Geography Class 8 ICSE is a part of the Class 8 Course Geography Class 8 ICSE.
All you need of Class 8 at this link: Class 8
|
11 videos|52 docs|10 tests
|
FAQs on Representation of Geographical Features Chapter Notes - Geography Class 8 ICSE
| 1. What are topographic maps and how do they represent landforms? |  |
Ans.Topographic maps are detailed representations of the Earth's surface that use contour lines to depict elevation and landforms. The contour lines connect points of equal elevation, allowing readers to visualize the terrain, such as hills, valleys, and slopes. The spacing of the contour lines indicates the steepness of the terrain; closely spaced lines signify steep areas, while widely spaced lines indicate gentle slopes.
| 2. How can I interpret contour lines on a topographical map? | |
Ans.Interpreting contour lines involves understanding their patterns and spacing. If the lines form concentric circles, it indicates a hill or a mountain. If the lines are V-shaped, they usually point upstream towards the source of a river. The elevation is typically marked at certain intervals, helping you to determine the height of different landforms. Additionally, the contour interval, which is the vertical distance between contour lines, is crucial for understanding changes in elevation.
| 3. What is the significance of settlements on topographic maps? | |
Ans.Settlements on topographic maps are indicated by various symbols, such as dots or squares, representing towns and cities. The location of these settlements is often influenced by the surrounding geography, such as proximity to water bodies, availability of arable land, and natural resources. The map can also show roads and communication networks that connect these settlements, highlighting human interaction with the landscape.
| 4. How do natural vegetation and irrigation appear on topographic maps? | |
Ans.Natural vegetation is usually represented by green shading or symbols indicating forests, grasslands, or other types of plant cover. Irrigation systems may be shown with blue lines or symbols to indicate canals and water channels. These features help in understanding how vegetation patterns and agricultural practices are influenced by the geography of the area.
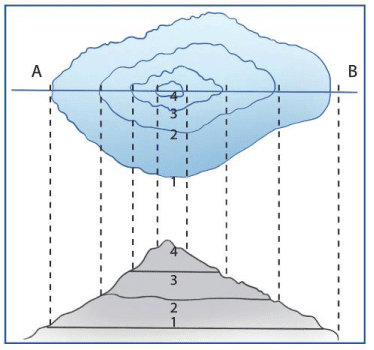
| 5. What is a profile of a survey map, and how is it useful? | |
Ans.A profile of a survey map is a side view or cross-section of the terrain along a specific line drawn on the topographic map. It illustrates the changes in elevation and can provide insights into the slope and gradient of the land. Profiles are useful for planning construction, understanding watershed areas, and studying land use, as they allow for a more comprehensive understanding of the terrain’s vertical characteristics.
About this Document

4.70/5
Rating

Sep 11, 2025
Last updated
Related Exams
Document Description: Chapter Notes: Representation of Geographical Features for Class 8 2025 is part of Geography Class 8 ICSE preparation.
The notes and questions for Chapter Notes: Representation of Geographical Features have been prepared according to the Class 8 exam syllabus. Information about Chapter Notes: Representation of Geographical Features covers topics
like Introduction, Topographic Maps, Contour, Mapping Landforms through Contours, Settlements, Interpretation of Topographical Sheets and Chapter Notes: Representation of Geographical Features Example, for Class 8 2025 Exam. Find important definitions, questions, notes, meanings, examples, exercises and tests below for Chapter Notes: Representation of Geographical Features.
Introduction of Chapter Notes: Representation of Geographical Features in English is available as part of our Geography Class 8 ICSE
for Class 8 & Chapter Notes: Representation of Geographical Features in Hindi for Geography Class 8 ICSE course.
Download more important topics related with notes, lectures and mock test series for Class 8
Exam by signing up for free. Class 8: Representation of Geographical Features Chapter Notes | Geography Class 8 ICSE
Description
Full syllabus notes, lecture & questions for Representation of Geographical Features Chapter Notes | Geography Class 8 ICSE - Class 8 | Plus excerises question with solution to help you revise complete syllabus for Geography Class 8 ICSE | Best notes, free PDF download
Information about Chapter Notes: Representation of Geographical Features
In this doc you can find the meaning of Chapter Notes: Representation of Geographical Features defined & explained in the simplest way possible. Besides explaining types of
Chapter Notes: Representation of Geographical Features theory, EduRev gives you an ample number of questions to practice Chapter Notes: Representation of Geographical Features tests, examples and also practice Class 8
tests

Related Searches
Previous Year Questions with Solutions
,Representation of Geographical Features Chapter Notes | Geography Class 8 ICSE
,shortcuts and tricks
,study material
,mock tests for examination
,Representation of Geographical Features Chapter Notes | Geography Class 8 ICSE
,Summary
,Semester Notes
,Sample Paper
,Important questions
,MCQs
,past year papers
,Extra Questions
,practice quizzes
,Free
,Viva Questions
,ppt
,Representation of Geographical Features Chapter Notes | Geography Class 8 ICSE
,video lectures
,Exam
,Objective type Questions
;


Additional Information about Chapter Notes: Representation of Geographical Features for Class 8 Preparation
Chapter Notes: Representation of Geographical Features Free PDF Download
The Chapter Notes: Representation of Geographical Features is an invaluable resource that delves deep into the core of the Class 8 exam.
These study notes are curated by experts and cover all the essential topics and concepts, making your preparation more efficient and effective.
With the help of these notes, you can grasp complex subjects quickly, revise important points easily,
and reinforce your understanding of key concepts. The study notes are presented in a concise and easy-to-understand manner,
allowing you to optimize your learning process. Whether you're looking for best-recommended books, sample papers, study material,
or toppers' notes, this PDF has got you covered. Download the Chapter Notes: Representation of Geographical Features now and kickstart your journey towards success in the Class 8 exam.
Importance of Chapter Notes: Representation of Geographical Features
The importance of Chapter Notes: Representation of Geographical Features cannot be overstated, especially for Class 8 aspirants.
This document holds the key to success in the Class 8 exam.
It offers a detailed understanding of the concept, providing invaluable insights into the topic.
By knowing the concepts well in advance, students can plan their preparation effectively.
Utilize this indispensable guide for a well-rounded preparation and achieve your desired results.
Chapter Notes: Representation of Geographical Features
Chapter Notes: Representation of Geographical Features Notes offer in-depth insights into the specific topic to help you master it with ease.
This comprehensive document covers all aspects related to Chapter Notes: Representation of Geographical Features.
It includes detailed information about the exam syllabus, recommended books, and study materials for a well-rounded preparation.
Practice papers and question papers enable you to assess your progress effectively.
Additionally, the paper analysis provides valuable tips for tackling the exam strategically.
Access to Toppers' notes gives you an edge in understanding complex concepts.
Whether you're a beginner or aiming for advanced proficiency, Chapter Notes: Representation of Geographical Features Notes on EduRev are your ultimate resource for success.
Chapter Notes: Representation of Geographical Features Class 8 Questions
The "Chapter Notes: Representation of Geographical Features Class 8 Questions" guide is a valuable resource for all aspiring students preparing for the
Class 8 exam. It focuses on providing a wide range of practice questions to help students gauge
their understanding of the exam topics. These questions cover the entire syllabus, ensuring comprehensive preparation.
The guide includes previous years' question papers for students to familiarize themselves with the exam's format and difficulty level.
Additionally, it offers subject-specific question banks, allowing students to focus on weak areas and improve their performance.
Study Chapter Notes: Representation of Geographical Features on the App
Students of Class 8 can study Chapter Notes: Representation of Geographical Features alongwith tests & analysis from the EduRev app,
which will help them while preparing for their exam. Apart from the Chapter Notes: Representation of Geographical Features,
students can also utilize the EduRev App for other study materials such as previous year question papers, syllabus, important questions, etc.
The EduRev App will make your learning easier as you can access it from anywhere you want.
The content of Chapter Notes: Representation of Geographical Features is prepared as per the latest Class 8 syllabus.
|
© EduRev
|
Education Revolution
|


|


Signup to see your scores
go up within 7 days!
Access 1000+ FREE Docs, Videos and Tests
Takes less than 10 seconds to signup