Two-Way Tables | Year 7 Mathematics IGCSE (Cambridge) PDF Download
| Table of contents |
|
| Key points |
|
| Using two-way tables |
|
| Understanding Two-Way Tables |
|
| Paraphrased Information on Two-Way Tables |
|
| Understanding Two-Way Table Data |
|
| Practise using two-way tables |
|
| Real-life maths |
|

Key points
 Image caption
- Data, a collection of facts or observations about something, can be represented in various ways. Two-way tables serve as a common data representation due to their ease of interpretation and ability to display the frequency of occurrences of two variables.
- In two-way tables, rows signify one variable while columns symbolize another. Each cell in the table showcases the frequency of data points that correspond to both variables.
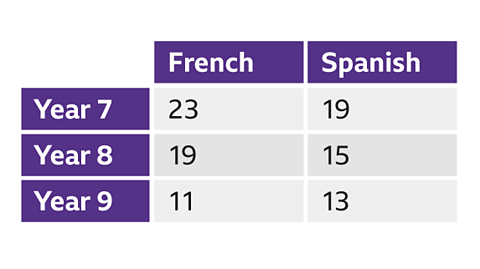 Image caption, Back to top
 Using two-way tables
- A two-way table shows the frequency of data which satisfies two variables.
- Each row represents one variable, and each column represents another. To read them, the cell which sits between the two will have the frequency of data points that fit both variables.
Explaining Two-Way Tables
- Two-way tables display how data aligns with two distinct variables.
- Every row signifies a specific variable, while each column signifies another. The intersection cell contains data point frequencies that meet both criteria.
Understanding Data Analysis
- Interpreting a two-way table allows us to grasp relationships between different data points.
- For instance, in a table showcasing age and handedness, finding the count of left-handed 12-year-olds involves locating the respective cell.
Understanding Two-Way Tables
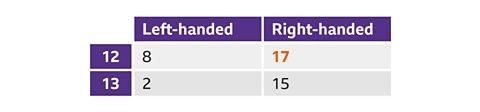
The data indicates that 17 of the 12-year-olds are right-handed.
Examples

Paraphrased Information on Two-Way Tables
Two-way tables are used to organize data in a structured manner. They help in visualizing relationships between two different variables.
Finding the Total Number of Students Taking the Bus to School
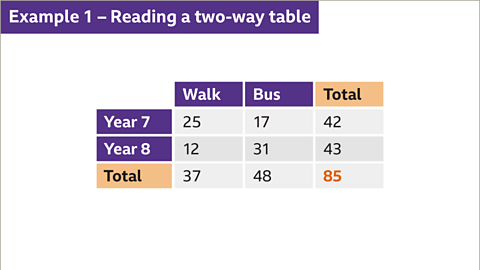
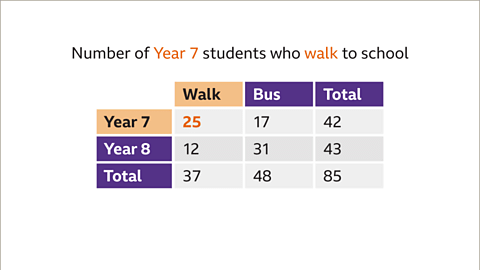
- To determine the total number of students who take the bus to school, locate the 'Total' row and the 'Bus' column in the table. The intersection of these two points reveals the total count of students taking the bus, which in this case is 48.
Finding the Total Number of Year 8 Students
- If you wish to find the total number of students in Year 8, scan across the 'Year 8' row and down the 'Total' column. The point where these two meet indicates the total count of Year 8 students, which is 43.
Completing a Two-Way Table Based on Survey Data
- In a different survey, a group of 100 students were asked about their preference between cats and dogs. You can complete the two-way table by incorporating this information accurately.
| Cats | Dogs | Total | |
|---|---|---|---|
| Year 7 | |||
| Year 8 | |||
| Total | 100 |
By filling in the survey data, you can complete the table to reflect the preferences of the students surveyed.
Understanding Two-Way Table Data
Two-way tables are essential tools in statistics to organize and display data based on two categorical variables.
Year 7 Student Data
- In Year 7, there were 47 students surveyed in total. This information is crucial for understanding the distribution of students.
Year 8 Student Data
- Out of the total 34 students who prefer cats, 28 of them are in Year 8. This indicates a preference pattern among students.
Distribution Analysis
- Among the students who prefer cats, 6 of them must be in Year 7 since the total count is 34. This showcases distribution across different years.
- Considering a total of 100 students, if 34 prefer cats, then 66 students must prefer dogs. Additionally, with 47 students in Year 7, there are 53 students in Year 8.
| Cats | Dogs | Total | |
|---|---|---|---|
| Year 7 | 6 | 47 | |
| Year 8 | 28 | 66 | 94 |
| Total | 34 | 66 | 141 |
Understanding Two-Way Tables
Two-way tables are essential tools used in statistics to organize and display data in a structured format. They consist of rows and columns, with each cell representing specific data points.
Interpreting Two-Way Table Data
- When analyzing a two-way table, we observe how variables are related and how they interact with each other.
- The data in the table provides insights into patterns, relationships, and trends within the dataset.
Example of Two-Way Table Analysis
- In a scenario where 85 students were surveyed about their preferred mode of transportation to school, the table showcases the distribution of responses among Year 7 and Year 8 students.
- The table includes categories such as 'walk' and 'bus,' with corresponding figures indicating the number of students in each category.
Looking at the provided images of two-way tables, we can see a visual representation of the data distribution and how it is organized within the table.
Question
Back to topPractise using two-way tables
Quiz
- Practice interpreting two-way tables and using a two-way table to record information with this quiz. You may need a pen and paper to help you with your answers.
Real-life maths
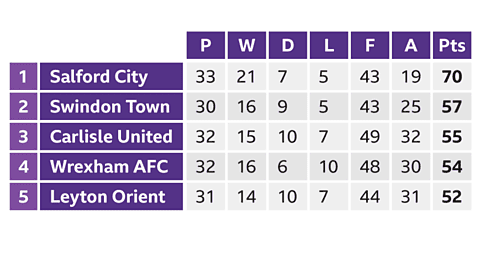
- In sports, the position of different teams is sorted into a two-way table according to their success rate and other performance facts.
- For instance, football league tables are two-way tables where each row represents a team, and each column represents different statistics about that team like total points scored or the number of games played.
- Two-way tables are utilized as they can effectively display a large amount of information at once, making it easy to read and understand.
 Back to top
Game - Divided Islands
Back to top|
28 videos|77 docs|22 tests
|


mock tests for examination
,Summary
,video lectures
,Two-Way Tables | Year 7 Mathematics IGCSE (Cambridge)
,Previous Year Questions with Solutions
,study material
,Two-Way Tables | Year 7 Mathematics IGCSE (Cambridge)
,Free
,past year papers
,Objective type Questions
,Viva Questions
,Semester Notes
,Exam
,Extra Questions
,MCQs
,shortcuts and tricks
,Sample Paper
,Important questions
,practice quizzes
,Two-Way Tables | Year 7 Mathematics IGCSE (Cambridge)
,ppt
;


Two-Way Tables Free PDF Download
Importance of Two-Way Tables
Two-Way Tables Notes
Two-Way Tables Year 7 Questions
Study Two-Way Tables on the App
|
© EduRev
|
Education Revolution
|


|


