Two-Way Tables | Year 7 Mathematics IGCSE (Cambridge) PDF Download

Key Points
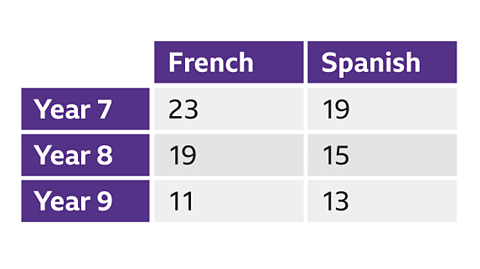 Image caption
- Data can be represented in various ways. Two-way tables are commonly used as they are easy to interpret and display the frequency of two variables.
- In two-way tables, rows signify one variable, while columns represent another. Each cell in the table indicates the frequency of data points that correspond to both variables.
- When utilizing two-way tables, rows symbolize one variable, and columns symbolize another. Each cell in the table represents how often data points match both variables.
In the context of two-way tables, rows and columns respectively depict different variables. The content in each cell demonstrates the frequency of data points that satisfy both variables.
Using two-way tables
- A two-way table illustrates the frequency of data that satisfies two different variables.
- Every row in a two-way table represents one variable, while each column represents another variable. The intersection cell shows the frequency of data points that meet both variables.
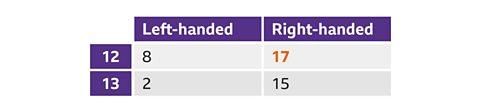
This specific two-way table summarizes data related to age and handedness. For instance, to determine the count of 12-year-olds who are right-handed in this table, locate the cell where the row corresponds to '12-year-olds' and the column corresponds to 'right-handed'.
 Image captionBack to top
Understanding Two-Way Tables
A two-way table provides a summary of data collected, typically about two categorical variables. It allows us to observe the relationship between these variables.
How to Interpret Two-Way Tables
- In a two-way table, each cell represents the intersection of a row and a column, showing the frequency or count of observations that fall into that category.
- To find specific information in a two-way table, locate the corresponding row and column headers to identify the cell containing the data point of interest.
Example: Analyzing Two-Way Table Data
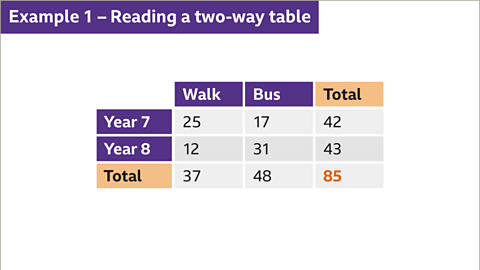
Let's consider an example with a table illustrating how students get to school:
- For instance, if we want to determine the number of Year 7 students who walk to school, we look at the intersection of the 'Year 7' row and the 'Walk' column in the table.
- By examining this intersection, we find that 25 Year 7 students walk to school, as indicated in the table.
Further Insights
- Two-way tables are valuable tools for organizing and interpreting categorical data effectively.
- They help in exploring relationships between two variables and drawing meaningful conclusions based on the observed frequencies.
Exploring Two-Way Table Examples
Example One: Transportation Choices of Students
Let's delve into another example involving a two-way table showcasing how students commute to school:
- In this scenario, the table provides information on how many students from different year groups choose to walk or take the bus to school.
- By examining the intersections of rows and columns, we can extract valuable insights into the transportation preferences of students across different categories.
Insight from the Example
- By analyzing the data presented in the two-way table, we can draw conclusions about the transportation habits of students based on their year groups.
- Such tables offer a structured way to represent and interpret complex categorical data, aiding in decision-making processes and statistical analyses.
Understanding Two-Way Tables
- Interpreting Data in Two-Way Tables
- When analyzing a two-way table, such as the one shown, locate the intersection of specific categories to find particular data points.
- For instance, in the given example, to determine the number of students who take the bus to school, identify where the 'Total' row and 'Bus' column meet.
- This method reveals that 48 students opt for the bus as their mode of transportation to school.
- Exploring Year-Based Data
- Another important aspect of two-way tables involves understanding data related to different years or categories.
- In the context of Year 8 students, for instance, by examining the 'Year 8' row and 'Total' column intersection, you can determine that there are a total of 43 Year 8 students.
- Completing Two-Way Tables with Survey Data
- Survey data can be effectively represented using two-way tables to organize and analyze information.
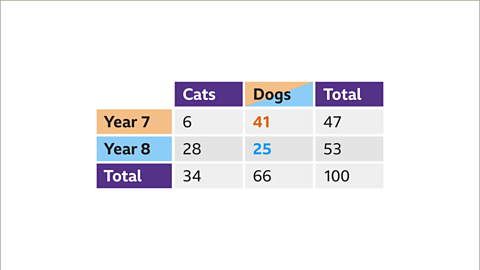
- In a hypothetical scenario with 100 students expressing preferences for cats or dogs, one can fill in the table accordingly to represent this data visually.
- By completing the table based on the survey results, students can grasp the distribution of preferences within the given population.
Visual Representation of Data
Visual aids like the two-way tables and accompanying images play a crucial role in making data more accessible and understandable for analysis and interpretation.
Paraphrased Information
Year 7 Data
In Year 7, a survey was conducted with a total of 47 students. The two-way table entry for 'Year 7' and 'Total' was filled with this count.
Year 8 Cat Preferences
Within the group of students who prefer cats, 34 students were identified, with 28 of them belonging to Year 8. This information was represented in the table with specific cell highlighting.
Year 7 Cat Preferences
Further analysis revealed that out of the 34 students who prefer cats, 6 were from Year 7. This calculation was displayed in the table, emphasizing Year 7 and cat preferences.
Dog Preferences
The total number of students preferring dogs was calculated at 66, deduced from the fact that 34 students prefer cats. With 100 students in total and 47 in Year 7, there were 53 Year 8 students. These figures were highlighted in the table accordingly.
Reading a Two-Way Table
- There are 41 Year 7 students who prefer dogs (47 - 6 = 41), and 25 Year 8 students who prefer dogs (53 - 28 = 25). The two-way table is now complete.
- 85 students were asked how they get to school. The results are shown in this two-way table.
Example of Reading a Two-Way Table
- An image of a two-way table displaying transportation preferences for Year 7 and Year 8 students.
- The table includes columns labeled "Walk" and "Bus" and rows labeled "Year Seven" and "Year Eight."
- Cell values represent the number of students using each mode of transportation.
- Additional rows and columns for totals are highlighted for clarity.
Interpreting the Data from the Table
- Understanding how to extract information from a two-way table.
- Identifying patterns and relationships between the variables represented in the table.
- Utilizing totals and individual cell values to draw conclusions about the data set.

Practise using two-way tables
- Two-way tables are practical tools used to organize data in a structured format.
- These tables help in comparing two sets of data simultaneously.
Real-life maths
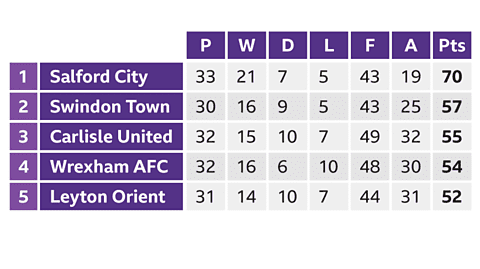
- In sports, teams' standings are often arranged in two-way tables based on their performance metrics.
- For instance, football league tables display team rankings and relevant statistical information.
- Each row in a two-way table corresponds to a team, while columns represent various statistics like points scored or games played.
- Two-way tables are preferred as they provide a clear and concise overview of multiple data points.
Game - Divided Islands
- This game involves strategic thinking and decision-making.
- Players navigate challenges by dividing resources effectively.
|
28 videos|77 docs|22 tests
|


study material
,ppt
,Objective type Questions
,past year papers
,Two-Way Tables | Year 7 Mathematics IGCSE (Cambridge)
,Two-Way Tables | Year 7 Mathematics IGCSE (Cambridge)
,Previous Year Questions with Solutions
,Exam
,Two-Way Tables | Year 7 Mathematics IGCSE (Cambridge)
,MCQs
,Summary
,Extra Questions
,practice quizzes
,Semester Notes
,Viva Questions
,video lectures
,Free
,shortcuts and tricks
,Sample Paper
,Important questions
,mock tests for examination
;


Two-Way Tables Free PDF Download
Importance of Two-Way Tables
Two-Way Tables Notes
Two-Way Tables Year 7 Questions
Study Two-Way Tables on the App
|
© EduRev
|
Education Revolution
|


|


