Risk & Return Analysis | Crash Course for UGC NET Commerce PDF Download

Understanding Investment Risk
Risk in investments refers to the potential for both negative and less favorable outcomes. It is closely associated with the concept of return, as investors seek to earn a profit based on an anticipated return, which may not always be realized. For example, risk and return are interconnected. When an individual invests in a financial asset, they do so with the expectation of gaining a profit. This decision is influenced by an anticipated return, which carries the possibility of being unexpected or adverse. Every decision involves some degree of risk, whether it’s a manufacturing manager choosing equipment, a marketing manager planning an ad campaign, or a finance manager managing a portfolio, all of them are dealing with uncertain cash flows.
Risk in Financial Analysis
- Financial analysis plays a crucial role in assessing risks and their potential impact on financial decisions.
- Theoretical risk is characterized by the variability in returns associated with a security.
- Investments that offer stable returns and guaranteed repayments are referred to as riskless securities or risk-free securities.
- On the other hand, assets with unpredictable returns are classified as risky assets.
- For instance, consider the following examples:
- Rs.1000, 12% 2020 Government of India Loan: This government loan carries very low risk because it is backed by a stable government, ensuring the timely payment of both interest and principal.
- Rs.100, 14.5% 2005 TISCO Non-Convertible Debentures: These corporate debentures offer some level of protection due to the underlying corporate assets and strong financial performance of TISCO. However, there remains a risk of underperformance and potential default.
Stress and Risk in Investment
- Many investors experience stress due to investment risk. When the secondary market does not align with rational expectations, the risk can be substantial, often without investors fully understanding the true risks involved in their investments.
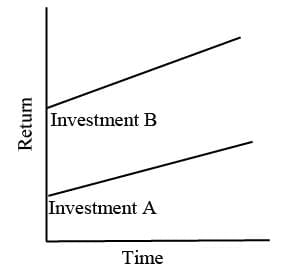
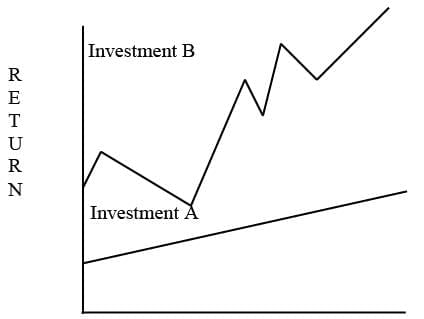
- Risk aversion is a common characteristic among small investors, who tend to prefer assets that offer reliable and consistent returns. When their expectations are not met, it can adversely impact their confidence in the market.
- These risk-averse investors typically favor assets that provide smaller, more predictable returns rather than those with the potential for larger but more volatile returns.
Types of Investors
- Within the financial system, there are also risk-taking investors and speculators. Speculators are willing to invest in securities that promise high returns, even though the certainty of those returns is lower.
- A healthy secondary market requires a balance of both risk-takers and risk-averse investors.
Evolution of Risk Connotations
In the 21st century, analysts began using financial statement data to assess the risk associated with a company's securities, with a particular focus on the amount of debt the company carried. The general principle was that higher levels of debt indicated greater risk for the securities. In their seminal work "Security Analysis," published in 1962, Graham, Dodd, and Cottle introduced the idea of "margin of safety" as a key measure of risk. They argued that security analysis should aim to determine a security's intrinsic value, which is separate from its market price. According to them, the intrinsic value of an asset is based on the analyst's assessment of its earning potential and financial characteristics, disregarding its current market price. The margin of safety is the gap between intrinsic value and market price, with a larger margin indicating lower risk.
Risk Measurement
- In addition to standard deviation, other metrics such as range, semivariance, and mean absolute deviation are utilized to evaluate risk.
- Nevertheless, standard deviation is the most widely accepted measure because it facilitates probability statements for various distributions.
- Total risk can be classified in two ways:
- First, into systematic and unsystematic risk.
- Second, into different components, each with its unique source.
- Risks related to factors like inflation, interest rates, and market sentiment can be divided into two categories:
- Those that impact all securities to varying extents.
- Those specific to an individual security, such as financial risk and business risk.
- Systematic risk refers to the variability of returns that moves in tandem with the market. This type of risk cannot be eliminated and poses a significant concern for investors.
- For instance, when prices rise, all companies experience changes in their expenses and returns, affecting return variability. This is a market-wide issue that is likely to persist. Investors seek compensation for this risk factor when calculating the expected rate of return.
- Conversely, non-systematic risk occurs when returns fluctuate due to specific factors related to a particular company. Examples include failing to secure a major contract or facing a higher risk of default on interest payments and debt obligations.
- Non-systematic risk is not considered when calculating the expected rate of return because it can be mitigated through portfolio diversification.
Sources of Risk
Understanding the sources of risk is crucial for investors when evaluating potential investments. Risk can arise from various factors, and it is important to identify and assess these sources to make informed investment decisions.
Market Risk
- Market risk refers to the potential for fluctuations in the prices of investments, particularly equity shares, even when a company's earnings remain stable.
- These price changes can occur due to various factors, including:
- Social events
- Political events
- Economic conditions
- Company-specific occurrences
- Market psychology also plays a significant role, with prices typically rising during bull markets and falling during bear markets.
- Market risk can be further categorized into:
- Systematic risk. Affects most stocks during market trends and is difficult to avoid.
- Unsystematic risk. Affects specific securities and can be managed through diversification.
Interest Rate Risk
- Interest rate risk pertains to the impact of changes in interest rates on the returns of securities, particularly fixed-income products like bonds and debentures.
- When interest rates rise, the expected or required return on other assets also increases, affecting the prices of existing securities.
- For example:
- When interest rates rise, the prices of existing bonds and debentures tend to fall.
- Conversely, when interest rates decrease, the prices of these securities generally rise.
- This relationship highlights the importance of interest rate risk in investment decisions.
Inflation Risk
- Inflation risk is concerned with the impact of changes in the overall purchasing power of an investment due to rising general price levels.
- When inflation increases, the purchasing power of cash flows, such as interest or dividends, diminishes.
- For instance:
- If the general price level rises while the return rate matches inflation, investors may not experience any real gains.
- It is essential to consider how inflation or deflation affects the expected cash flows from an investment to assess inflation risk accurately.
Business Risk
- Business risk arises from the inherent uncertainties and fluctuations in expected income that businesses face due to various factors.
- Factors contributing to business risk include:
- Changes in government policies, such as subsidies, which can negatively impact specific industries.
- Actions of competitors, both domestic and international, that can influence a company's performance.
- Environmental changes that affect many businesses, although these may not be linked to specific sources.
- For example, the business cycle can significantly impact sectors like steel, automotive, and transportation, leading to variations in earnings from year to year.
- Diversifying portfolios across different industries can help mitigate company-specific risks.
Financial Risks in Capital Structure
Financial risk is introduced when a company's capital structure includes debt. Debt creates a fixed obligation, increasing the variability of income available to equity shareholders. While this can enhance profitability and returns for stock investors in good times, it can also lead to significant issues in difficult times.
Debt Obligations
- Debt obligations can create challenges for current debt security holders, as too much debt can make it difficult to seize and sell assets to meet liabilities due to lengthy legal processes.
- If a company cannot meet its debt obligations, it can face several problems, including:
- Difficulty in securing funding from suppliers
- Loss of key employees
- Negative impact on its reputation, making it harder to attract customers
Management Risk
Management risk refers to the variability in total return caused by decisions made by managers, especially in companies where the owners are not also the managers. Even experienced management teams can make mistakes, and management errors are a significant contributor to overall investor risk.
Some common management mistakes that can increase risk include:
- Ignoring product obsolescence by failing to invest in Research and Development (R&D) and promote new products before old ones become outdated.
- Relying heavily on one large customer, which can increase risk, as seen with software firms trying to diversify their customer base.
- Handling criticisms poorly, such as discontinuing a product due to misguided legal challenges, which can lead to significant losses for investors.
Owner vs Manager Dynamics
- Recent research suggests that owners typically work harder than managers who do not own shares of the company. Non-owner managers may have strong incentives to indulge in non-monetary perks, leading to potential conflicts of interest.
- This can result in non-owner managers abusing their power, harming the owners’ interests. Consequently, reasonable investors might pay more for shares in owner-managed companies compared to those managed by employees. The price difference is known as agency cost, and while this theory has faced criticism, it is gaining acceptance.
Liquidity Risk
Liquidity risk pertains to the difficulty a seller encounters when attempting to sell assets without significantly lowering prices or incurring high commissions. Assets can be categorized based on their liquidity as follows:
- Currency. A country’s currency is the most liquid asset, as it is immediately saleable at par without discounts.
- Government Securities and Blue-Chip Stocks. These are the next most liquid assets, as they can be sold quickly without substantial price reductions.
- Debt Securities and Equity Shares from Smaller Companies. These assets are often less liquid, as they may take longer to sell and could require price concessions.
Due to liquidity issues, investors may find themselves needing to sell securities at lower prices than anticipated, particularly when dealing with large quantities. Thus, liquidity risk is a crucial factor to consider when selecting securities.
Social or Regulatory Risk
Social or regulatory risk occurs when a successful business faces challenges due to adverse laws, stringent regulations, or, in extreme cases, nationalisation by a socialist government. This type of risk is primarily political and unpredictable. Examples of social or regulatory risk include:
- Price Controls. These can diminish the revenues of industrial companies by restricting the prices they can charge for their products.
- Rent Controls. These may significantly reduce the value of rental properties by capping the rents landlords can charge.
In a representative democracy where government involvement in business affairs is on the rise, no industry can expect to be entirely shielded from social or regulatory risk.
Risks in Foreign Investments: Monetary Value Risk and Political Environment Risk
When investors consider foreign assets like government bonds or stocks from overseas companies, they face two significant types of risk: monetary value risk and political environment risk. These risks are crucial to understand, especially when the goal is to achieve slightly better returns than what local options offer.
- Monetary Value Risk: This risk involves the potential loss of value in the investment due to changes in the monetary situation of the foreign country. Factors such as currency fluctuations, inflation rates, and changes in interest rates can impact the real value of the returns.
- Political Environment Risk: This risk pertains to the political stability and governance of the foreign country. It includes the possibility of government actions that could negatively affect investments, such as:
- Repudiation of Debt:. change in the foreign government could lead to the refusal to honor outstanding debt obligations, putting investors at risk.
- Nationalisation: Businesses in the foreign country could be taken over by the government, which would affect foreign ownership and investment rights.
- Economic Pressures: Foreign governments or companies may face challenges in managing their debt due to economic pressures, which could impact their ability to meet financial obligations.
Investors need to carefully weigh these higher risks against the expected returns from foreign investments, which may come in the form of interest, dividends, or capital gains. The potential for higher returns must justify the increased risks associated with investing in foreign assets.
Understanding Risk Perspectives in Management
Managers have different perspectives on risk, making it crucial to define an accepted level of risk clearly. The three primary risk preferences are:
- Risk Aversion: Most managers fall into this category. They believe that taking on more risk should be accompanied by the potential for higher rewards. Risk-averse managers are generally more cautious and prefer stability over uncertainty. For example, a risk-averse financial manager might choose an investment that offers a higher return to compensate for the increased risk involved.
- Risk Indifference: Some managers are indifferent to risk, meaning they do not have a strong preference for taking on more or less risk. They focus more on the potential outcomes rather than the level of risk involved.
- Risk-Seeking:. few managers are willing to take on higher risks in the hope of achieving greater rewards. They are more daring in their approach to risk management.
Generally, most managers are risk-averse. They expect that any increase in risk should come with a higher potential reward. This cautious approach influences their decision-making processes and strategies in managing risks within the organization.
Types of Risk
There are two types of risk, namely Systematic Risk and Unsystematic Risk
Systematic Risk
Systematic risk is the portion of return variability resulting from factors that impact all firms. This type of risk cannot be mitigated through diversification. Examples of systematic risk include:
- Changes in government interest rate policy.
- Increases in corporate tax rates.
- Significant deficit financing by the government.
- Rising inflation rates.
- Implementation of restrictive credit policies by the Central Bank.
- Inability of the government to attract Foreign Institutional Investors (FIIs).
Unsystematic Risk
Unsystematic risk refers to the variability in an investment's return due to factors specific to the company rather than the overall market. This type of risk can be entirely mitigated through diversification. Examples of unsystematic risk include:
- Strikes by workers in a company.
- Departure of a key R&D expert from the company.
- Entry of a strong competitor into the market.
- Loss of a significant contract in a bidding process.
- Achieving a breakthrough in innovation by the company.
- Increased government customs duties on materials used by the company.
- Difficulty in obtaining sufficient raw materials by the company.
Total risk is the combination of systematic and unsystematic risk, as these components add together. Systematic risk is typically evaluated by comparing a stock's performance to the market under various conditions. For instance, if a stock appreciates more than others during favorable periods and depreciates more during unfavorable periods, its systematic risk is higher than the market risk. The market's beta is usually set at one, and the systematic risk of all stocks is expressed concerning the market index's systematic risk by calculating a value known as beta. When stock returns are regressed on market-index returns, the stock's beta equals the regression coefficient's beta. For example, if a stock has a beta of 1.50, it is expected to increase in price by 1.5 times compared to the market return of 1. If the market declines by a certain percentage, the stock is anticipated to fall 1.5 times as much.
Risk Vs. Uncertainty
Although risk and uncertainty are often used interchangeably, they have distinct meanings. Risk implies that a decision-maker is aware of the possible outcomes and their probabilities. In contrast, uncertainty refers to a situation where the likelihood of an event is unknown. Investors strive to maximize expected returns while staying within their risk tolerance. The level of risk is influenced by the characteristics of assets, investment instruments, and the method of investment.
Causes of Risk
Various factors can contribute to risk in investments, including:
- Incorrect investment method.
- Inappropriate timing of investment.
- Improper investment amount.
- Interest rate risk.
- Type of investment instruments.
- Nature of the industry.
- Specifics of the business being invested in.
- National and international factors.
- Natural disasters.
Calculating Historical Returns on Investment
When measuring the total return on investment over a specific period, two key components are considered: Cash Payments and Price Change.
To calculate the total return, use the following formula: Total Return = (Cash Payments + Price Change) / Initial Price.
Cash payments can vary and may be positive or negative. The price change is determined by subtracting the initial price from the final price, which can result in a positive, zero, or negative change.
- A Positive change occurs when the final price is higher than the initial price.
- A Zero change happens when the final price is the same as the initial price.
- A Negative change occurs when the final price is lower than the initial price.
The formula for calculating return (R) is as follows: R = (C + (PE – PB)) / PB
- R represents the total return over the specified period.
- C denotes the cash payment received during the period.
- PE indicates the ending price of the investment.
- PB refers to the beginning price of the investment.
Example of Return Calculation
Let’s consider an example of an equity stock to illustrate the calculation of total return:
- Beginning Price: Rs.70.00
- Dividend Paid: Rs.5.00
- Ending Price: Rs.80.00
To calculate the total return on this stock, we would use the formula:
Total Return = (Cash Payments + Price Change) / Initial Price
In this case, the cash payment is the dividend paid, and the price change is the difference between the ending price and the beginning price:
- Cash Payments: Rs.5.00 (dividend)
- Price Change: Rs.80.00 - Rs.70.00 = Rs.10.00
Now, plugging these values into the formula:
Total Return = (5.00 + 10.00) / 70.00
This simplifies to:
Total Return = 15.00 / 70.00 = 0.2143 or 21.43%
Therefore, the total return on this stock for the year would be approximately 21.43%.
Measuring Historical Risk
 Standard Deviation
Risk refers to the possibility that the actual outcome of an investment will differ from what was anticipated. It can also represent the variation or spread of returns. An asset is deemed risk-free if its returns show no variation. When evaluating the total return on a stock over a specific period, it is crucial to consider not only the average return but also the extent of variability in the returns.
Variance and Standard Deviation
The most prevalent methods for assessing risk in finance are variance and its square root, known as standard deviation. Historical risk, in terms of variance and standard deviation, can be defined as follows:
- Standard deviation. √σ²
Where:
- σ² = Variance of Returns
- Ri = return from the stock in period i (i=1,…,n)
- n = average of returns
- σ = standard deviation
For instance, if the initial rate of return is 16% and the stock returns over 6 years are:
- R1 = 16%
- R2 = 12%
- R3 = 20%
- R4 = -13%
- R5 = 15%
- R6 = 10%
The variance and standard deviation of returns can be calculated as follows: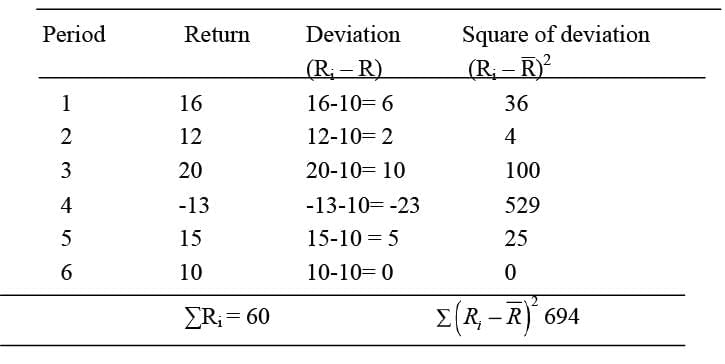
Adding these values results in:
- ∑Ri = 60
- ∑(Ri - R)² = 694
From this, it can be determined that:
- Variance. 138.8 and Standard deviation. 11.78
- The squared differences from the mean indicate that values farther from the mean have a more significant impact on the standard deviation compared to those closer to it.
- The standard deviation is calculated by taking the square root of the average of the squared variances, allowing for a direct comparison with the mean since they are in the same units.
Measuring Expected Return and Risk
Previously, we focused on historical (ex post) return and risk. Now, let's delve into predicted (ex-ante) return and risk.
Probability Distribution
When you invest in a stock, the returns can vary significantly. For instance, you might see returns of 5%, 15%, or even 35%. Each of these returns comes with a different likelihood, which is where probability distributions come into play. Probability helps us understand how likely an event is to occur. For example, if there's an 80% chance that stock A will increase in price over the next two weeks, it means there's an 80% probability of an increase and a 20% probability that it will remain the same.
- Outcome Probability:
- Stock price will rise: 0.80
- Stock price will not rise: 0.20
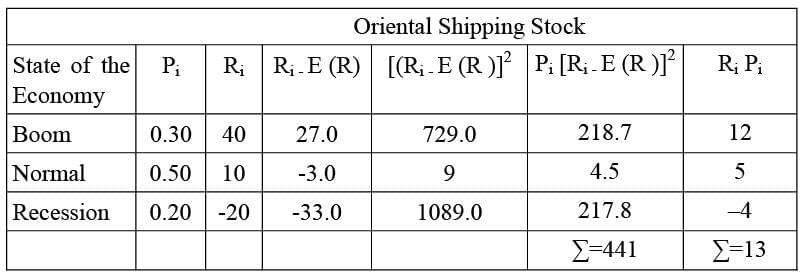
To illustrate, let's consider two stocks: Bharat Foods and Oriental Shipping. Bharat Foods might yield returns of 0.16, 0.11, or 0.06, each with specific probabilities. On the other hand, Oriental Shipping, being more volatile, could offer returns of 0.40, 0.10, or -0.20 with the same probabilities. The following table presents the probability distributions for these stocks: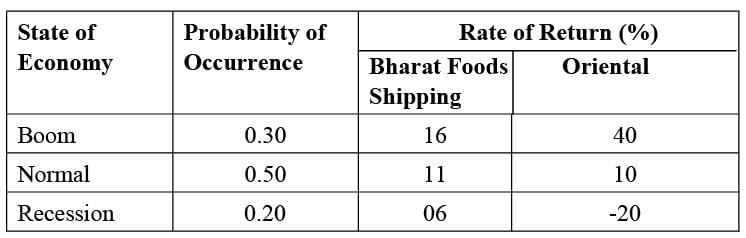
By analyzing the probability distribution of returns, we can derive two crucial values:
Expected Rate of Return
The expected rate of return represents the average of all potential returns, weighted by their probabilities. This can be expressed mathematically as:

Where,
- E (R) = expected return from the stock
- Ri = return from stock under state i
- Pi = probability that the state i occurs
- n = number of possible states of the world
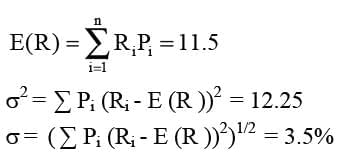
From the above equation, E(R) is the weighted average of possible outcomes – each outcome is weighted by the probability associated with it. The expected rate of return on Bharat Foods stock is:
E(RB) = (0.30) (.16%) + (0.50) (.11%) + (0.20) (6%) = 11.5%
E(RB) = .048+.055+.012=0.115=11.5%
Similarly, the expected rate of return on Oriental Shipping stock is:
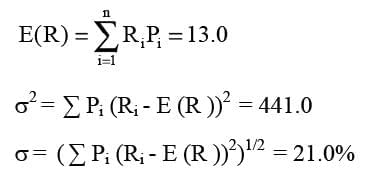
E(RO) = (0.30) (40%) + (0.50) (10%) + (0.20) (-20%) = 13.0%
= .12+.05+ (-.04)=.13=13%
Standard Deviation of Return
Risk is commonly associated with the variability of a variable, often measured using variance or standard deviation. Variance is calculated by averaging the squared differences between actual returns and the expected return, weighted by probabilities:
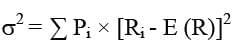
In this equation:
- σ2 = Variance
- Ri =return for the ith possible outcome
- Pi = Probability associated with the ith possible outcome
- E(R) = Expected return
Since variance is expressed in squared terms, it can be intricate, which is why we often use its square root, the standard deviation, as a more straightforward measure.

Solution:
Taking expected return as 11.5%, we calculate: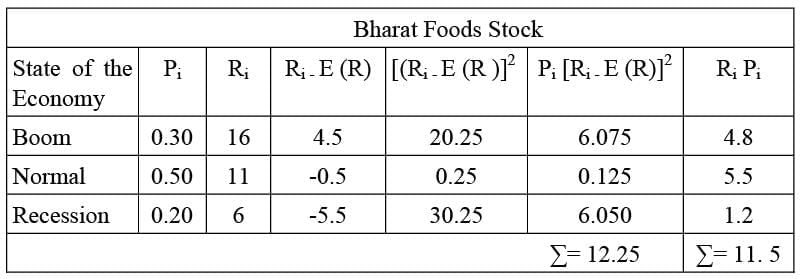
Taking expected return as 13%, we calculate:
|
145 videos|236 docs|166 tests
|
FAQs on Risk & Return Analysis - Crash Course for UGC NET Commerce
| 1. What is the importance of risk & return analysis in investment decisions? |  |
| 2. How is risk measured in risk & return analysis? | |
| 3. What factors influence the risk & return of an investment? | |
| 4. How can investors use risk & return analysis to diversify their portfolios? | |
| 5. How can risk & return analysis help investors achieve their financial goals? | |


past year papers
,Extra Questions
,Objective type Questions
,practice quizzes
,Semester Notes
,shortcuts and tricks
,MCQs
,study material
,Sample Paper
,Viva Questions
,Important questions
,Previous Year Questions with Solutions
,Free
,ppt
,Risk & Return Analysis | Crash Course for UGC NET Commerce
,Risk & Return Analysis | Crash Course for UGC NET Commerce
,Summary
,Risk & Return Analysis | Crash Course for UGC NET Commerce
,video lectures
,Exam
,mock tests for examination
;


Risk & Return Analysis Free PDF Download
Importance of Risk & Return Analysis
Risk & Return Analysis Notes
Risk & Return Analysis UGC NET Questions
Study Risk & Return Analysis on the App
|
© EduRev
|
Education Revolution
|


|


