NCERT Solutions for Class 7 Maths - Data Handling- 3

Ques 1: Fill in the blanks:
(i) The Mean of the first 5 natural numbers is ___________
(ii) Range of the data 12, 15, 7, 9, 16, 18 is ___________
(iii) Median of the data 38, 40, 42, 48, 65, 72, 75, is ___________
(iv) Mode of the data 2, 3, 5, 6, 7, 3, 2, 9 is ___________
Ans: (i) 3
(ii) 11
(iii) 48
(iv) 2,3
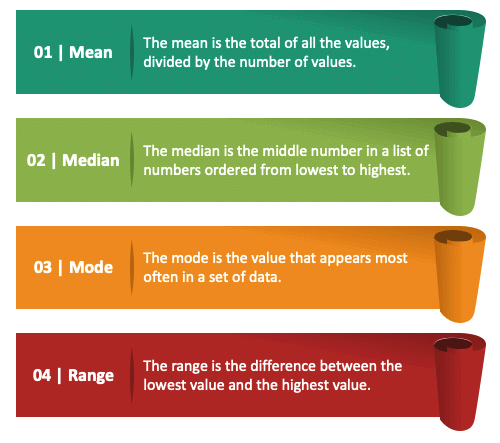 Mean, Median, Mode and Range
Ques 2: A die is thrown once. Find the probability of the following:
(i) Getting a number greater than 5.
(ii) Getting a prime number.
(iii) Getting an even natural number.
(iv) Getting a number less than 4.
Ans: (i) 1/6
(ii) 1/2
(iii) 1/2
(iv) 1/2
Ques 3: If the mean of 9, 5, 7, x, 6 is 6, find the value of x.
Ans: 3
Ques 4: What is the range of these integers? 20, 6, 18, –15, –12, 0
Ans: 35
Ques 5: State whether the given statements are true or false
(i) The Mean of the data is always from the given data.
(ii) The range of the data 2, 9, 6,5, 8 would change if 3 was added to each value in the data.
(iii) When a coin is tossed, there are two possible outcomes.
(iv) The probability of selecting you as a monitor within the class is greater than one.
Ans: (i) False
(ii) False
(iii) True
(iv) False
Ques 6: Study the bar graph given below and answer the questions that follow:
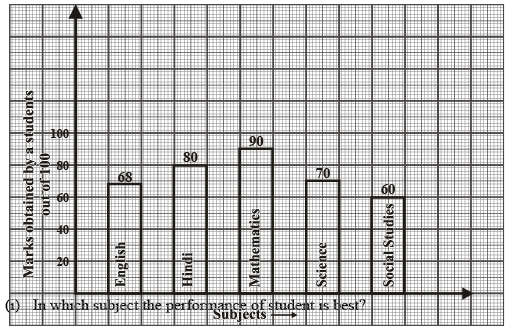
(ii) Calculate the average marks of the student.
(iii) If 75 and above marks denote a distinction, then name the subjects in which the student got a distinction.
(iv) Calculate the percentage of marks the student got out of 500.
Ans: (i) Mathematics
(ii) 73.6
(iii) Hindi, Mathematics
(iv) 73.6%
Ques 7: Observe the following data and answer the questions that follow:
Days of the Week | Mon | Tue | Wed | Thu | Fri | Sat |
No. of plants planted by students in a school | 25 | 45 | 35 | 38 | 40 | 30 |
(i) Draw a bar graph to represent the above-given information.
(ii) On which day of the week maximum number of plants planted by students?
(iii) Find the ratio of the minimum and maximum number of plants planted.
(iv) Find the total no. of plants planted.
Ans: (i)
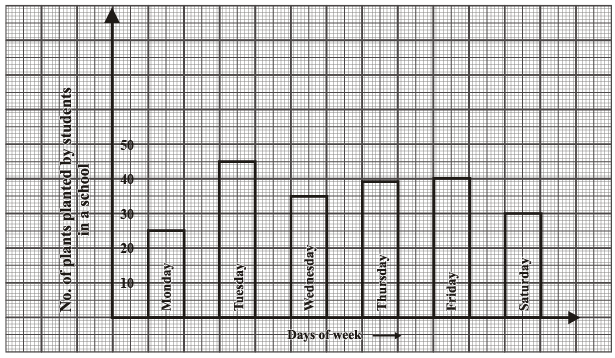
(ii) Tuesday
(iii) 5:9
(iv) 213
Ques 8: Study the double bar graphs given below and answer the following questions:
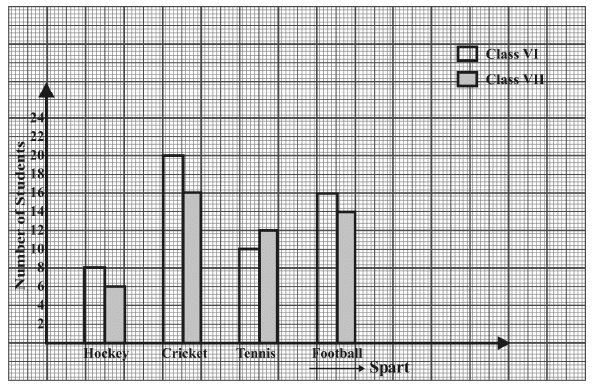
(i) Which sport is liked the most by class VII students?
(ii) How many students are there in class VII if each student plays only one sport?
(iii) How many students of class VI like hockey and football in all?
(iv) For which sport the number of students of class VII is more than that of class VI.
Ans: (i) Circket
(ii) 48
(iii) 24
(iv) Tennis
|
76 videos|452 docs|39 tests
|
FAQs on NCERT Solutions for Class 7 Maths - Data Handling- 3
| 1. What is data handling? |  |
| 2. What are the different types of data? | |
| 3. How can data be collected? | |
| 4. What is the importance of data handling in research? | |
| 5. What are the common tools or software used for data handling? | |


NCERT Solutions for Class 7 Maths - Data Handling- 3
,MCQs
,video lectures
,shortcuts and tricks
,Viva Questions
,Previous Year Questions with Solutions
,Important questions
,practice quizzes
,Sample Paper
,Exam
,Objective type Questions
,ppt
,NCERT Solutions for Class 7 Maths - Data Handling- 3
,Free
,Summary
,past year papers
,Extra Questions
,Semester Notes
,mock tests for examination
,NCERT Solutions for Class 7 Maths - Data Handling- 3
,study material
;


NCERT Solutions: Data Handling- 3 Free PDF Download
Importance of NCERT Solutions: Data Handling- 3
NCERT Solutions: Data Handling- 3 Notes
NCERT Solutions: Data Handling- 3 Class 7 Questions
Study NCERT Solutions: Data Handling- 3 on the App
|
© EduRev
|
Education Revolution
|


|


within 7 days!