Class 2 Exam > Class 2 Notes > Math Olympiad for Class 2 > Mind Map: Pictograph
Mind Map: Pictograph | Math Olympiad for Class 2 PDF Download

The document Mind Map: Pictograph | Math Olympiad for Class 2 is a part of the Class 2 Course Math Olympiad for Class 2.
All you need of Class 2 at this link: Class 2
|
34 videos|104 docs|84 tests
|
FAQs on Mind Map: Pictograph - Math Olympiad for Class 2
| 1. What is a pictograph and how is it used in data representation? |  |
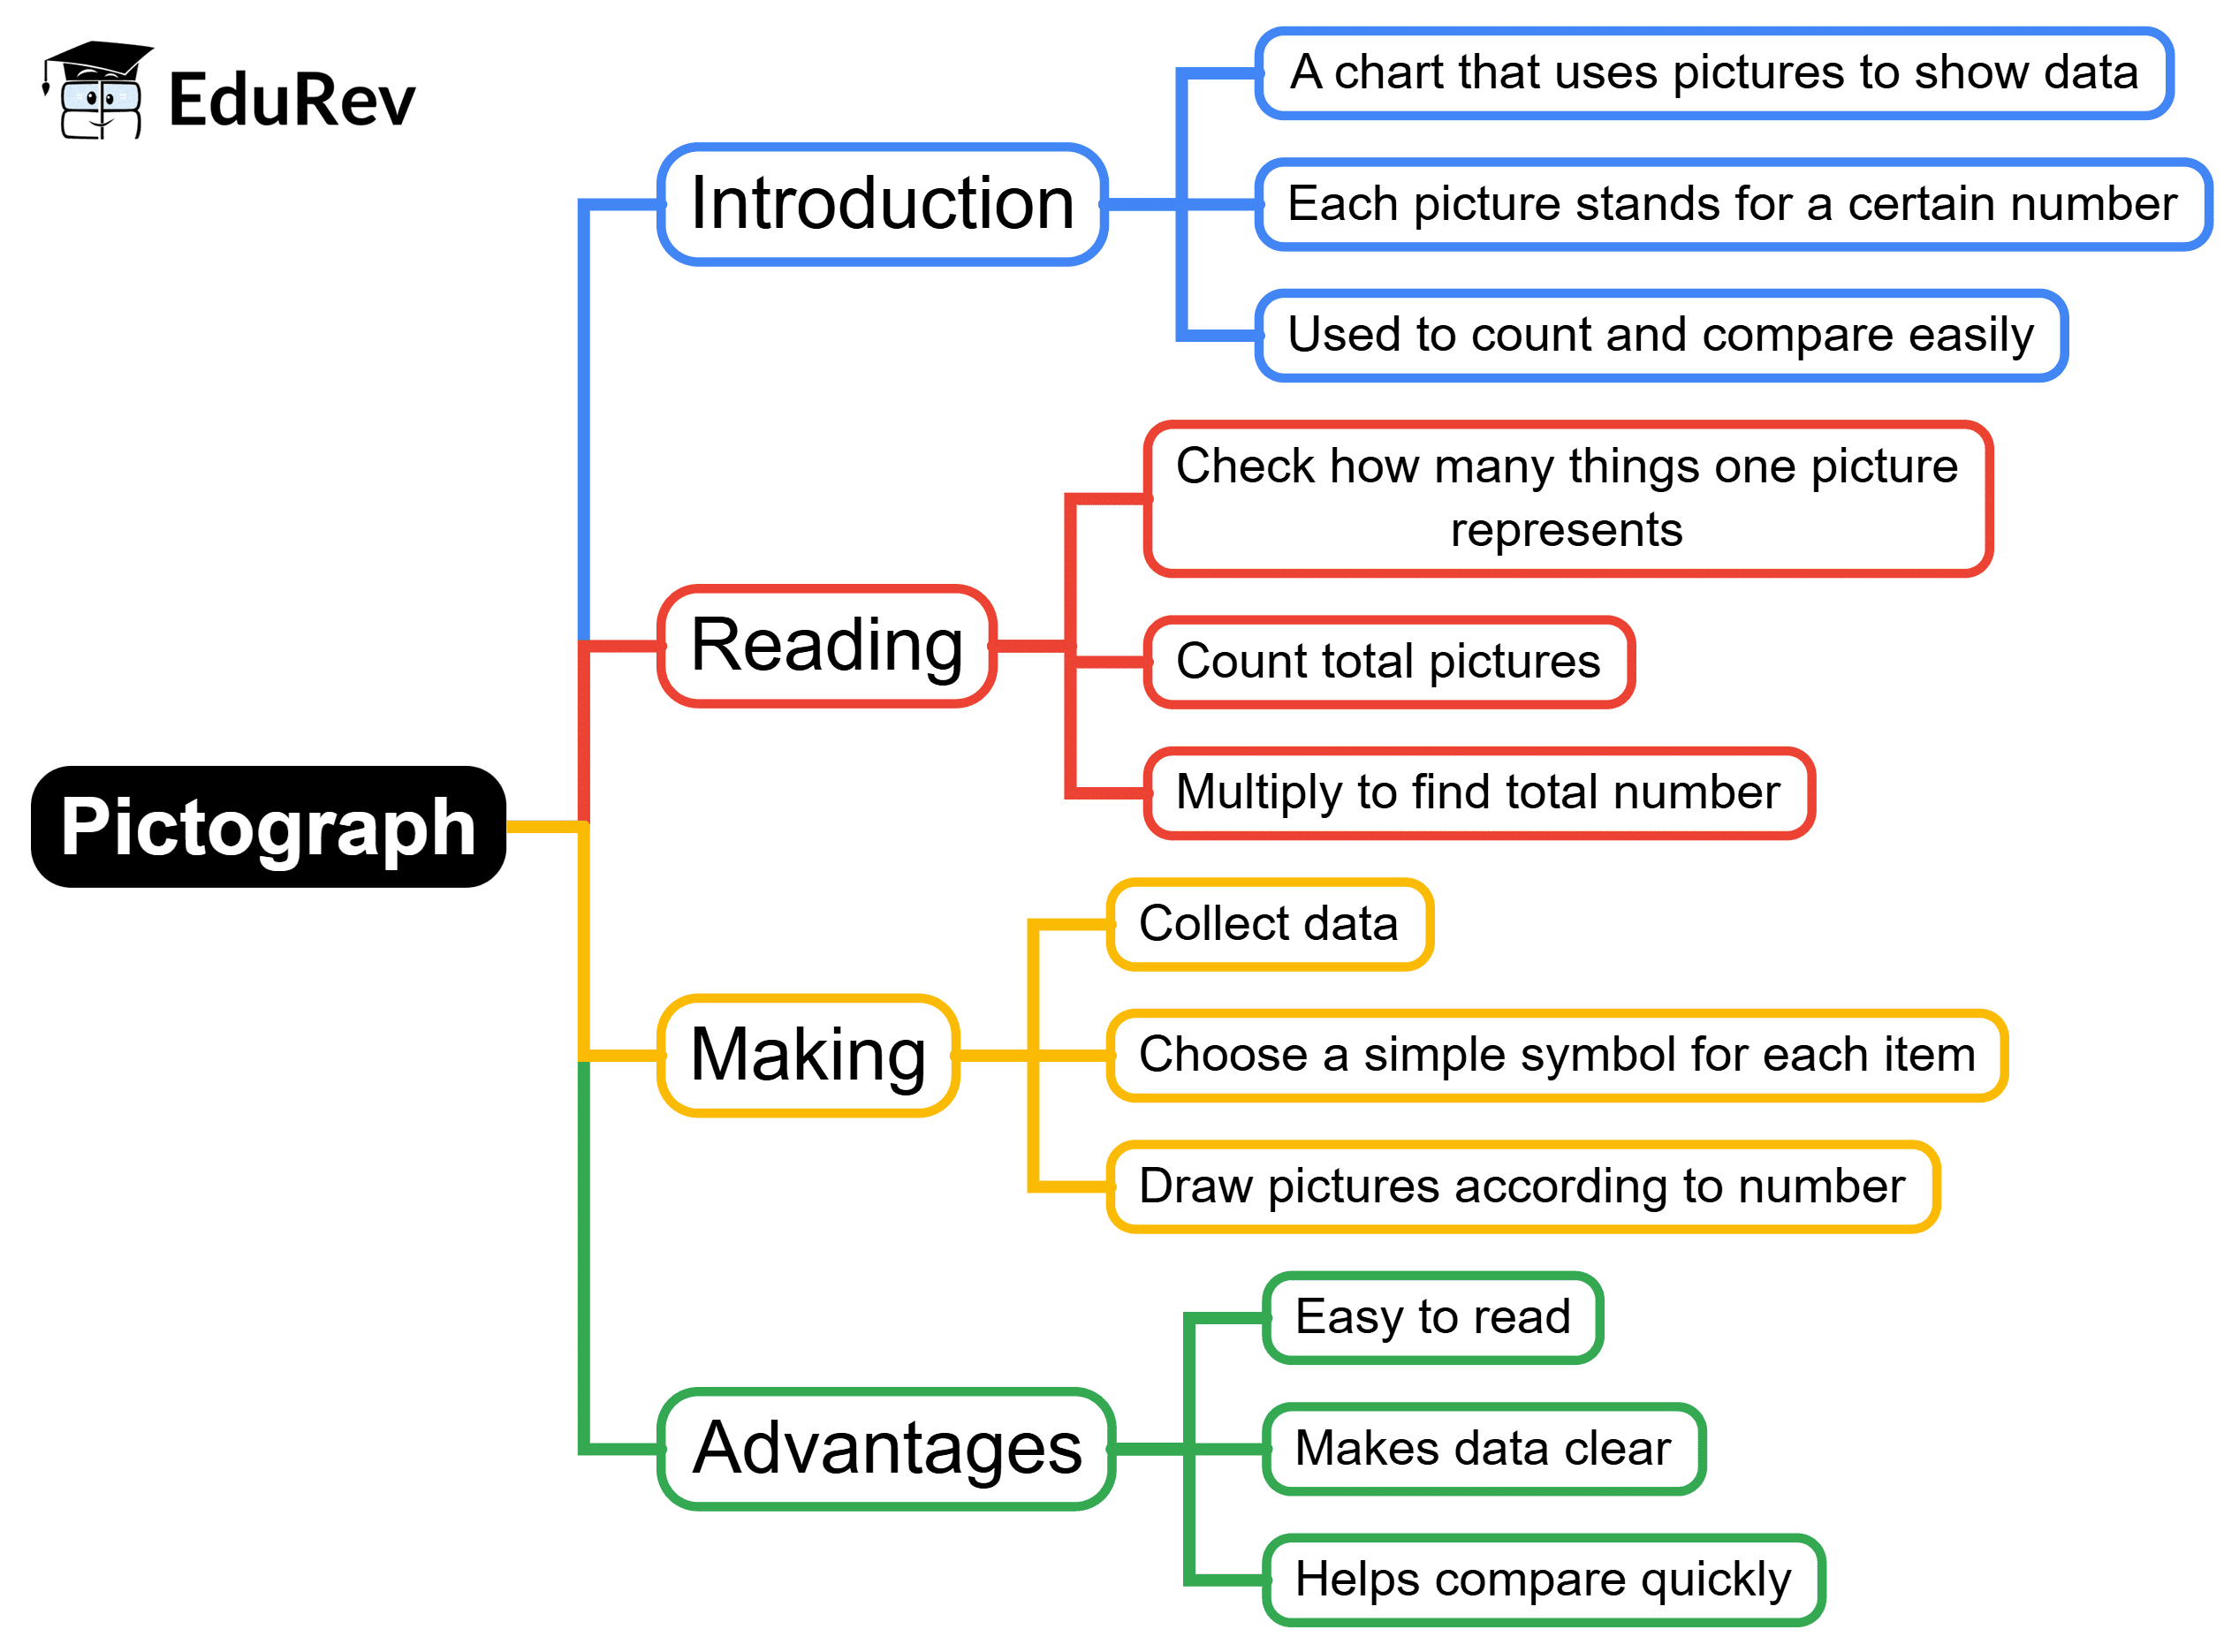
Ans. A pictograph is a visual representation of data using images or symbols to convey information. Each symbol in a pictograph typically represents a specific quantity, making it easier for viewers to understand the data at a glance. Pictographs are commonly used in educational settings to teach young students about data interpretation and to present simple statistics in a clear and engaging manner.
| 2. What are the advantages of using pictographs in presenting information? |  |
Ans. The advantages of using pictographs include their ability to simplify complex information, enhance visual appeal, and engage audiences, particularly children. They can help make comparisons more intuitive and allow for quick recognition of trends and patterns in data. Additionally, pictographs can accommodate various audiences, making them effective in educational and informative contexts.
| 3. How can students create their own pictographs? |  |
Ans. Students can create their own pictographs by first collecting data on a particular subject, such as favorite fruits or pets. They should tally the results and assign a specific image or symbol to represent a certain number of items, such as one symbol for every five votes. After determining the symbols, students can organize them in a chart format, ensuring to label the axes and provide a title for clarity.
| 4. What are some common mistakes to avoid when interpreting pictographs? |  |
Ans. Common mistakes to avoid when interpreting pictographs include misreading the symbols' values, failing to consider the scale represented by each symbol, or overlooking the context in which the data is presented. It's also important to be cautious of any missing information or unclear labels, as these can lead to misunderstandings of the data being conveyed.
| 5. In what subjects or areas are pictographs most frequently used? |  |
Ans. Pictographs are most frequently used in subjects such as mathematics and social studies. In mathematics, they help students learn about data representation and analysis. In social studies, pictographs can visually represent demographic information, survey results, or trends over time, making complex data more accessible and understandable for learners.
Related Searches


