Important Formulas: Functions | Quantitative for GMAT PDF Download
| Table of contents |
|
| Introduction |
|
| What is a Function? |
|
| Basic Methods of Representing Functions |
|
| Key Formulas & Properties for Functions |
|

Introduction
Functions are fundamental in modeling real-life relationships in business, economics, and analytics. For example, a profit function can relate the quantity of goods sold to total profit, aiding in decision-making and forecasting. Understanding functions is crucial for data analysis, optimization, and interpreting business scenarios.
What is a Function?
A function is a clear relationship between two sets:
Domain (X): The set of all possible input values.
Codomain (Y): The set of all possible output values.
A function f: X → Y assigns each element in X to exactly one element in Y.
Independent variable (x): Input value.
Dependent variable (y = f(x)): Output value.
Basic Methods of Representing Functions
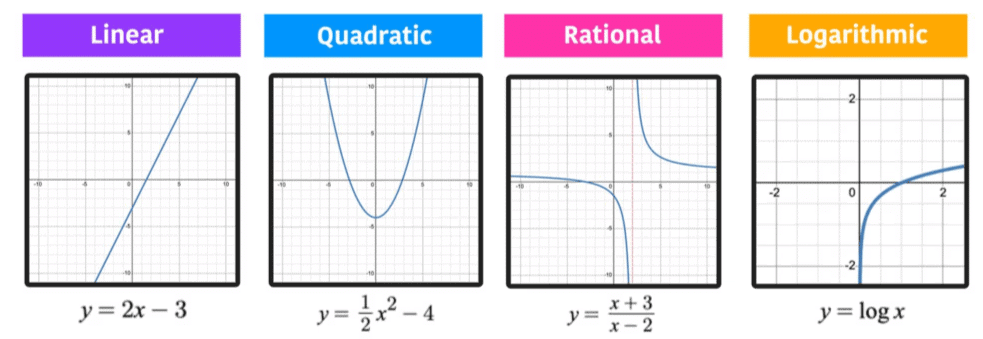
1. Analytical Representation
A function is expressed using a formula:
Single formula: y = 3x²
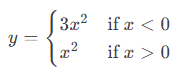
Piecewise formula:
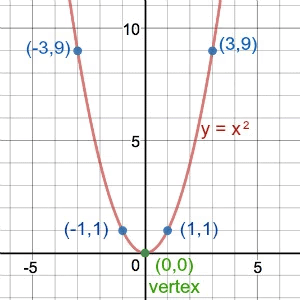
2. Graphical Representation
A function is plotted on the x-y plane, where each point (x, y) corresponds to (x, f(x)).
Example: Graph of f(x) = x² for X = {-3, -1, 1, 3}.
3. Tabular Representation
A table lists x and corresponding y = f(x) values.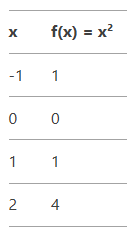
Key Formulas & Properties for Functions
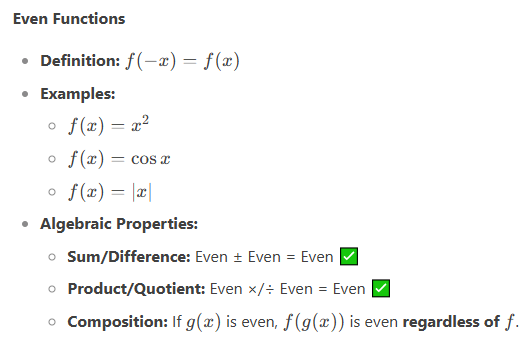
1. Even Functions
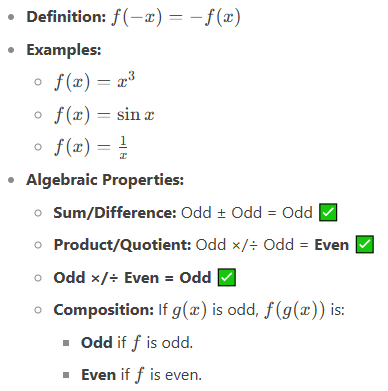
2. Odd Functions
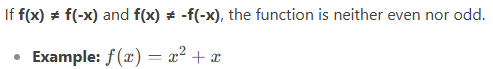
3. Neither Even Nor Odd
4. Identity Function
Defined as f(x) = x.
Graph is a straight line at 45° passing through the origin.
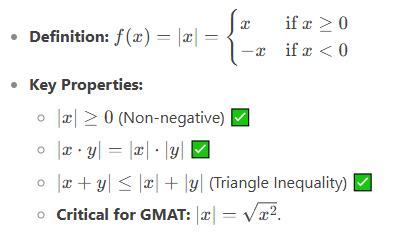
5. Absolute Value Function
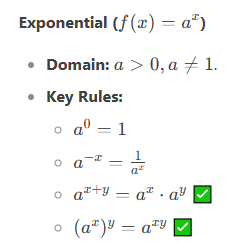
6. Exponential Function
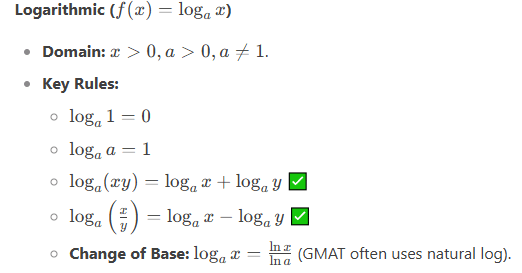
7. Logarithmic Function
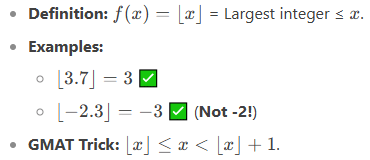
8. Greatest Integer (Floor) Function
9. Function Transformations (Critical for GMAT)
Vertical Shifts
f(x)+c → Up by c ✅
f(x)−c → Down by c ✅
Horizontal Shifts
f(x+c) → Left by c ✅
f(x−c) → Right by c ✅
Reflections
−f(x) → Reflects over x-axis ✅
f(−x) → Reflects over y-axis ✅
Absolute Value Transformation
∣f(x)∣ → Negative parts flip above x-axis ✅
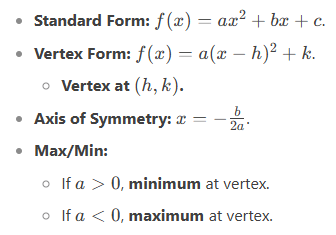
10. Quadratic Functions
|
127 videos|154 docs|111 tests
|
FAQs on Important Formulas: Functions - Quantitative for GMAT
| 1. What is a function in mathematics? |  |
| 2. What are the basic methods of representing functions? | |
| 3. What are some key properties of functions? | |
| 4. What are some important formulas related to functions? | |
| 5. How can understanding functions help in preparing for exams like the CAT? | |


mock tests for examination
,ppt
,Previous Year Questions with Solutions
,Sample Paper
,Semester Notes
,Extra Questions
,Exam
,Viva Questions
,practice quizzes
,past year papers
,Important Formulas: Functions | Quantitative for GMAT
,MCQs
,study material
,Important Formulas: Functions | Quantitative for GMAT
,Objective type Questions
,Summary
,shortcuts and tricks
,Free
,Important Formulas: Functions | Quantitative for GMAT
,Important questions
,video lectures
;


Important Formulas: Functions Free PDF Download
Importance of Important Formulas: Functions
Important Formulas: Functions Notes
Important Formulas: Functions GMAT Questions
Study Important Formulas: Functions on the App
|
© EduRev
|
Education Revolution
|


|


within 7 days!