CA Foundation Exam  >  CA Foundation Notes  >  Quantitative Aptitude for CA Foundation  >  Cheatsheet: Linear Inequalities

Cheatsheet: Linear Inequalities | Quantitative Aptitude for CA Foundation PDF Download

Linear Inequalities - Concept & Graphical Method Cheat Shee<span class="fr-marker" data-id="0" data-type="true" style="display: none; line-height: 0;"></span><span class="fr-marker" data-id="0" data-type="false" style="display: none; line-height: 0;"></span<span class="fr-marker" data-id="0" data-type="true" style="display: none; line-height: 0;"></span><span class="fr-marker" data-id="0" data-type="false" style="display: none; line-height: 0;"></span>

What is a Linear Inequality?

A linear inequality is similar to a linear equation, but instead of an equals sign (=), it uses inequality signs, such as <, >, <=, or >=. It represents a region of solutions rather than exact points.

Examples of Linear Inequalities

  • One variable: x > 0, x ≤ 5
  • Two variables: 3x + y ≤ 6, x - y ≥ -2

Question for Cheatsheet: Linear Inequalities
Try yourself:
What is an example of a linear inequality with two variables?
View Solution

Graphing a Linear Inequality

  1. Replace the inequality with an equality and draw the line.
  2. Use a solid line for or , and dashed line for < or >.
  3. Test a point (usually the origin) to determine which side to shade.
  4. The shaded area represents the solution space.
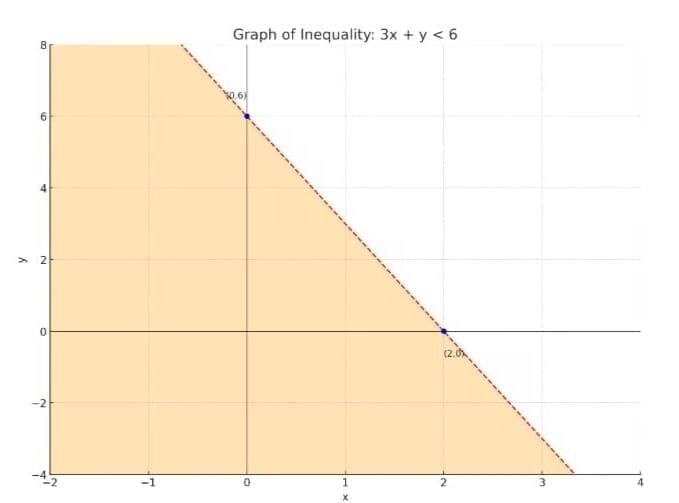
Example: Graph 3x + y < 6
Convert to equality: y = 6 - 3x
Plot (0,6) and (2,0); then shade below the line since y < 6 - 3x
Cheatsheet: Linear Inequalities | Quantitative Aptitude for CA Foundation

Step 1: Convert to equality → 3x + y = 6 → y = 6 - 3x
Step 2: Plot points (0,6) and (2,0) to draw the dashed boundary line
Step 3: Since it’s ‘<’, shade below the line (strict inequality)
Note: Dashed line indicates the boundary is not included

System of Inequalities

A system of inequalities includes two or more inequalities. The solution set is the region where all shaded areas overlap.

Example: Find the feasible region for:
3x + y ≤ 6
x - y ≤ -2
x ≥ 0, y ≥ 0
Plot all four, and find the overlapping shaded region (feasible region).
Cheatsheet: Linear Inequalities | Quantitative Aptitude for CA Foundation

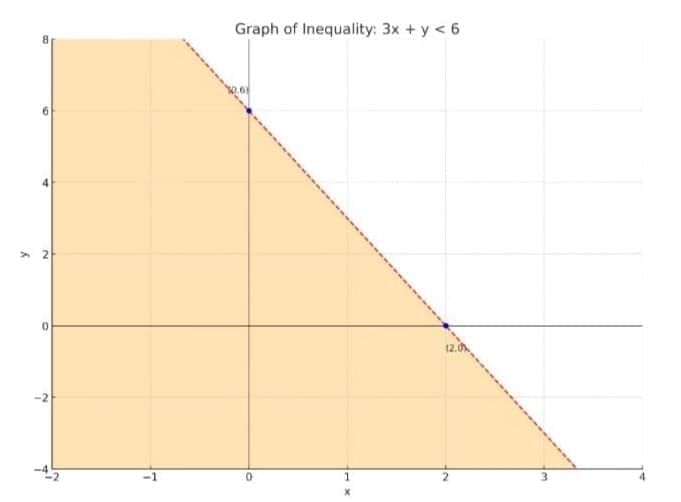
Step 1: Start with the inequality: 3x + y < 6
Step 2: Convert it to equality to find the boundary line:
        3x + y = 6 → y = 6 - 3x
Step 3: Find two points on the line:
        When x = 0, y = 6 → (0, 6)
        When x = 2, y = 0 → (2, 0)
Step 4: Plot these points and draw a dashed line through them
        (dashed because the inequality is ‘<’, not ‘≤’)
Step 5: Shade the region below the line since the inequality is y < 6 - 3x
Final: The shaded area represents all solutions to the inequality.

Feasible Region & Optimal Solution

  • The region satisfying all constraints is the feasible region.
  • It is bounded if enclosed, and unbounded if open-ended.
  • Extreme points (corners) of this region help find max/min of an objective function.
  • To maximise Z = ax + by, evaluate Z at all corner points.

Question for Cheatsheet: Linear Inequalities
Try yourself:
What does the feasible region represent?
View Solution

Objective Function & Matrix Method

Let matrix E contain corner points, and C be the coefficient vector of the objective function.

Multiply: EC to get function values. The max/Min value of EC gives the optimal point.

Example: Maximise Z = x + 2y at points (0,0), (6,0), (5,7), (0,7)
C = [1, 2]
E = [[0,0], [6,0], [5,7], [0,7]]
Z-values = 0, 6, 19, 14 → Max = 19 at (5,7)

Solution: 

Goal: Maximize Z = x + 2y
Coefficient Vector: C = [1, 2]
Corner Points Matrix E:
 E = [[0, 0],
    [6, 0],
    [5, 7],
    [0, 7]]

Step 1: Multiply E and C to get Z values:
 Z = E × C = [0, 6, 19, 14]

Step 2: Identify the optimal value:
 Maximum Z = 19 at point (5, 7)

Optimal Solution: Max Z = 19 at (5, 7)

Word Problems to Inequalities

  • Translate constraints into inequalities.
  • Identify objective (maximise profit, minimise cost).
  • Examples: resource limits, time restrictions, production mix.
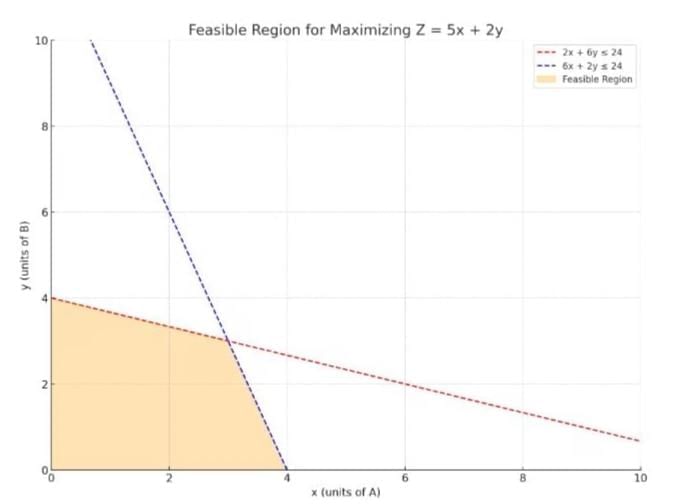
Example: A product A takes 2 hours on M1, 6 hours on M2. B takes 6 on M1, 2 on M2.
Maximise profit Z = 5x + 2y subject to:
2x + 6y ≤ 24
6x + 2y ≤ 24
x ≥ 0, y ≥ 0
Cheatsheet: Linear Inequalities | Quantitative Aptitude for CA Foundation

Step 1: Define variables:
 Let x = units of A, y = units of B

Step 2: Write constraints from time usage:
 Machine M1: 2x + 6y ≤ 24
 Machine M2: 6x + 2y ≤ 24
 Also: x ≥ 0, y ≥ 0 (non-negativity)

Step 3: Objective Function:
 Maximize Z = 5x + 2y (profit)

Step 4: Graph the inequalities and identify feasible region
 (Area that satisfies all constraints)

The document Cheatsheet: Linear Inequalities | Quantitative Aptitude for CA Foundation is a part of the CA Foundation Course Quantitative Aptitude for CA Foundation.
All you need of CA Foundation at this link: CA Foundation
101 videos|267 docs|89 tests

FAQs on Cheatsheet: Linear Inequalities - Quantitative Aptitude for CA Foundation

1. What is a linear inequality?
Ans. A linear inequality is a mathematical expression that represents a relationship between two variables where one variable is not equal to the other, typically expressed in the form ax + by < c, ax + by> c, or ax + by ≥ c. Here, a, b, and c are constants, and x and y are variables. The inequality indicates that the values of x and y do not satisfy a strict equality but rather fall within a range.
2. How do you graph a linear inequality?
Ans. To graph a linear inequality, first graph the corresponding linear equation (e.g., ax + by = c) as a straight line on a coordinate plane. Use a dashed line for inequalities that do not include equality (e.g., < or >) and a solid line for those that do (e.g., ≤ or ≥). Next, select a test point not on the line (often (0,0) is a good choice) to determine which side of the line represents the solution set. Shade the appropriate region that satisfies the inequality.
3. What is a system of inequalities?
Ans. A system of inequalities is a collection of two or more inequalities involving the same variables. The solution to the system is the set of all points (x, y) that satisfy all the inequalities simultaneously. Graphically, this is represented by the overlapping shaded regions of each inequality on a coordinate plane, which shows the feasible solutions.
4. What is a feasible region in the context of linear inequalities?
Ans. The feasible region is the area on a graph where all the constraints represented by a system of linear inequalities are satisfied. It is typically a polygonal area bounded by the lines representing the inequalities. The optimal solution, if one exists, is often found at one of the vertices (corners) of this feasible region.
5. What is an objective function in linear programming?
Ans. An objective function is a mathematical expression that defines the goal of a linear programming problem, usually in terms of maximising or minimising a quantity, such as profit or cost. It is typically represented as Z = ax + by, where Z is the objective value, and a and b are coefficients that represent the contribution of variables x and y. The objective function is subject to certain constraints defined by linear inequalities.
Related Searches

MCQs

,

Free

,

past year papers

,

Previous Year Questions with Solutions

,

ppt

,

Cheatsheet: Linear Inequalities | Quantitative Aptitude for CA Foundation

,

Extra Questions

,

Cheatsheet: Linear Inequalities | Quantitative Aptitude for CA Foundation

,

Important questions

,

pdf

,

practice quizzes

,

Objective type Questions

,

video lectures

,

Viva Questions

,

shortcuts and tricks

,

Cheatsheet: Linear Inequalities | Quantitative Aptitude for CA Foundation

,

Exam

,

Sample Paper

,

Semester Notes

,

Summary

,

mock tests for examination

,

study material

;