Probability (Term 4) Chapter Notes | Mathematics for Grade 6 PDF Download
| Table of contents |
|
| Tossing a Coin |
|
| Spinner Experiments |
|
| The Subtraction Game |
|
| The Addition Game |
|
| Points to Remember |
|
| Difficult Words |
|
| Summary |
|

 Probability
Tossing a Coin
This section explores probability using the simple experiment of tossing a coin.Coin Toss Basics
- A coin has two sides: heads (shows the country’s coat of arms) and tails (shows the coin’s value).
- Each toss has two possible outcomes: heads or tails.
- Probability: The chance of getting heads or tails is equal (1/2 or 50% each).
- Example: Tossing a coin many times results in roughly equal numbers of heads and tails due to randomness.
Comparing to Real-World Scenarios
Example: Throwing a ball against a wall and catching it:
- Success (catching) depends on skill, not equal to failing (unlike a coin toss).
- Coin tosses are purely random, with no skill involved.
Recording Data
Use a table to record coin toss results:
- Columns: Heads (tallies), Tails (tallies), Total heads, Total tails.
- Example: 10 tosses per trial, repeated 5 times (50 tosses total).
- Analyze: Expect approximately 25 heads and 25 tails, but actual results may vary slightly due to chance.
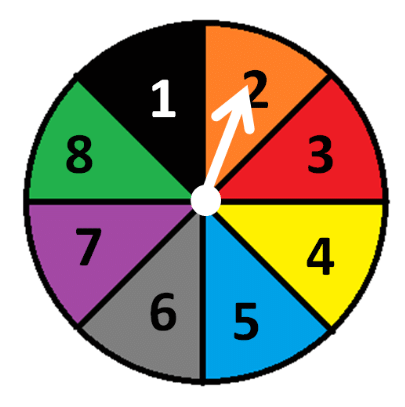
Spinner Experiments
This section uses spinner experiments to study probability with varying outcome chances.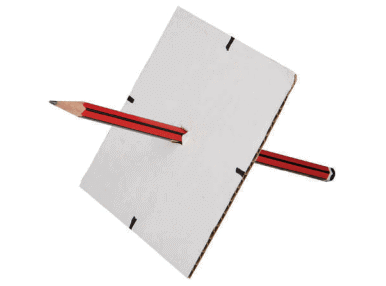 Creating a Spinner
Spinner: A square cardboard with a pencil through the center, marked with dots on each side.
Experiment sheets (A4 paper, colored at the center):
- Sheet 1: 2/4 red, 2/4 blue (equal areas).
- Sheet 2: 1/4 red, 3/4 blue (unequal areas).
- Sheet 3: 1/4 red, 1/4 blue, 1/4 green, 1/4 yellow (equal areas).
Collecting Data
Use a 10 × 10 grid (100 squares) on squared paper for each experiment (labeled Experiment 1, 2, 3).
Process:
- Spin the spinner on the sheet’s center.
- Shade a grid square in the color where the dot lands (red, blue, etc.), from left to right, row by row, until 100 squares are shaded.
Experiments:
- Experiment 1 (Sheet 1): Expect 50 red, 50 blue (2/4 = 1/2 each).
- Experiment 2 (Sheet 2): Expect 25 red, 75 blue (1/4 red, 3/4 blue).
- Experiment 3 (Sheet 3): Expect 25 each of red, blue, green, yellow (1/4 each).
Analyzing Results
Expectations:- Experiment 1: 1/2 red, 1/2 blue.
- Experiment 2: 1/4 red, 3/4 blue.
- Experiment 3: 1/4 each color.
Observations:
- Compare actual fractions (e.g., red squares ÷ 100) to expected fractions.
- Check for patterns (random vs. consistent).
- Identify runs (consecutive same-color outcomes, e.g., 3 red blocks in a row).
- Compare longest runs and their frequency across classmates’ data.
Comparison to Coin Toss:
- Coin toss (heads = red, tails = blue) mimics Experiment 1 (equal chances).
- Experiments 2 and 3 have unequal probabilities, unlike a coin.
Equivalent Experiments
- Experiment 2: Similar to a die with 1 face red, 3 faces blue (1/4 vs. 3/4).
- Experiment 3: Similar to a 4-sided die or 2 coins with outcomes mapped to red, blue, green, yellow (1/4 each).
The Subtraction Game
This section introduces a probability game with two dice to explore fairness.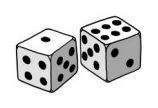
Game Setup
Subtraction Game: Two players, each rolls a die (blue, red; numbers 1 to 6).Rules:
- Subtract smaller number from larger (e.g., blue 2, red 5 → 5 - 2 = 3).
- Each player picks 3 numbers from possible results (0, 1, 2, 3, 4, 5).
Example: Player 1: 0, 4, 5; Player 2: 1, 2, 3. - If the difference matches a player’s numbers, they score 1 point.
- Play 12 rounds; highest score wins.
Outcomes: All pairs (e.g., (1, 6), (6, 1)) give differences 0 to 5.
Analyzing Outcomes
Possible outcomes: 6 × 6 = 36 combinations (each die has 6 faces).Differences:
- Use a table to list differences (e.g., row 2, column 5 → 5 - 2 = 3).
- Results: 0, 1, 2, 3, 4, 5.
Frequency:
- 0: 6 ways (e.g., (1, 1), (2, 2)).
- 1: 10 ways (e.g., (2, 1), (3, 2)).
- 2: 8 ways.
- 3: 6 ways.
- 4: 4 ways.
- 5: 2 ways.
Chances:
For 0, 4, 5: 6 + 4 + 2 = 12/36 = 1/3.
For 1, 2, 3: 10 + 8 + 6 = 24/36 = 2/3.
Fairness: Rules are unfair; 1, 2, 3 have twice the chance (2/3 vs. 1/3).
Making the Game Fair
Adjust rules to equalize chances:
Example: Assign numbers so each set has equal probability (e.g., split outcomes evenly).
The Addition Game
This section explores a probability game based on adding two dice outcomes.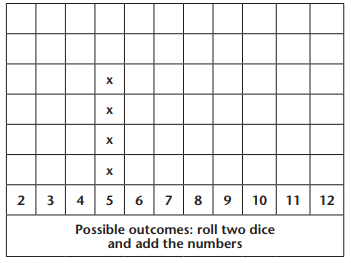
Game Setup
- Addition Game: Roll two dice, add the numbers.
- Possible results: 2 to 12 (e.g., (1, 1) = 2, (6, 6) = 12).
- Outcomes: 36 combinations (6 × 6).
Frequencies (from a table):
- 2: 1 way (1, 1).
- 3: 2 ways.
- 4: 3 ways.
- 5: 4 ways.
- 6: 5 ways.
- 7: 6 ways.
- 8: 5 ways.
- 9: 4 ways.
- 10: 3 ways.
- 11: 2 ways.
- 12: 1 way.
Single Die Expectation
- Rolling one die 10 times: Expect numbers 1 to 6 roughly equally (about 1-2 times each) due to equal probability (1/6).
Visualizing Data
- Create a pictograph to show frequencies of sums (e.g., 5 has 4 ways, mark 4 ‘x’s).
- 11 possible results (2 to 12), 36 total outcomes.
Creating a Fair Game
Fair rules: Assign sums to players so each has an equal chance to score.
- Example: Split sums (e.g., Player 1: 2, 3, 4, 11, 12; Player 2: 5, 6, 7, 8, 9, 10) to balance probabilities.
- Test fairness: Play 10 times; more plays (e.g., 30) give better fairness insight.
Points to Remember
- Probability: Chance of an outcome (e.g., 1/2 for heads in a coin toss).
- Equal probability: Coin toss (1/2 heads, 1/2 tails) or spinner with equal areas.
- Unequal probability: Spinner with unequal areas (e.g., 1/4 red, 3/4 blue).
- Run: Consecutive same outcomes (e.g., 3 red blocks).
- Fair game: Equal winning chances for players (e.g., balanced number sets).
- Outcomes: All possible results (e.g., 36 for two dice).
- Frequency: How often an outcome occurs (e.g., sum 7 in 6/36 ways).
Difficult Words
- Probability: The chance an event happens (e.g., 1/2 for heads).
- Outcome: A possible result (e.g., heads, tails).
- Run: Repeated same outcomes (e.g., 3 reds in a row).
- Fair: Giving equal chances to win.
- Spinner: A tool for random outcomes (e.g., colored areas).
- Frequency: Number of times an outcome occurs.
- Pictograph: A chart using symbols to show data.
Summary
This chapter equips Grade 6 students with skills to understand probability through experiments like coin tosses (1/2 heads, 1/2 tails), spinners (e.g., 1/4 red, 3/4 blue), and dice games (e.g., Subtraction Game with 36 outcomes). Students learn to predict outcomes, analyze data for patterns, and evaluate game fairness, fostering critical thinking in chance and randomness.FAQs on Probability (Term 4) Chapter Notes - Mathematics for Grade 6

ppt
,Semester Notes
,Viva Questions
,Sample Paper
,Summary
,Previous Year Questions with Solutions
,mock tests for examination
,Important questions
,Extra Questions
,practice quizzes
,Probability (Term 4) Chapter Notes | Mathematics for Grade 6
,Probability (Term 4) Chapter Notes | Mathematics for Grade 6
,Exam
,shortcuts and tricks
,Probability (Term 4) Chapter Notes | Mathematics for Grade 6
,video lectures
,study material
,MCQs
,past year papers
,Free
,Objective type Questions
;


Chapter Notes: Probability (Term 4) Free PDF Download
Importance of Chapter Notes: Probability (Term 4)
Chapter Notes: Probability (Term 4)
Chapter Notes: Probability (Term 4) Grade 6 Questions
Study Chapter Notes: Probability (Term 4) on the App
|
© EduRev
|
Education Revolution
|


|


within 7 days!