Grade 9 Exam > Grade 9 Notes > AP Statistics > Chapter Notes: Introducing Statistics: Should I Worry About Error?
Introducing Statistics: Should I Worry About Error? Chapter Notes | AP Statistics - Grade 9 PDF Download

No statistical study is perfect, and there is always a chance of error occurring. There are several sources of error that can affect the results of a statistical study, including sampling error, measurement error, and bias.
- Sampling Error: Sampling error occurs when the sample used in the study is not representative of the population being studied. This can lead to incorrect conclusions being drawn about the population based on the sample data.
- Measurement Error: Measurement error occurs when there is an error in the measurement of the variables being studied due to the presence of confounding variables. This can also lead to incorrect conclusions being drawn.
- Bias: Bias is another source of error that can occur in statistical studies. Bias can occur in the sampling process, the measurement process, or in the analysis of the data. Bias can lead to incorrect conclusions being drawn about the population being studied.
Type I Errors
A Type I error, also known as a false positive, is an error that occurs when the null hypothesis is rejected when it should have been accepted. The probability of a Type I error occurring is equal to the alpha level, which is the level of significance that is chosen for the study. A common alpha level is 0.05, which means that there is a 5% chance of making a Type I error.
It's important to choose an appropriate alpha level for a study, as a lower alpha level (e.g., 0.01) will result in a higher probability of making a Type I error, while a higher alpha level (e.g., 0.1) will result in a lower probability of making a Type I error. It's also crucial to consider the consequences of making a Type I error, as rejecting the null hypothesis when it is true can lead to incorrect conclusions being drawn about the population being studied.
Example
Let's say an author claims that the mean income for a given area is $45,000.
We sample a group of 50 families and find that the mean income of our sample is $42,500. In performing a statistical test, we would reject the author's claim. If we made an error in our study (either due to sampling or random chance), this would be a Type I error
Type II Errors
A Type II error, also known as a false negative, is an error that occurs when the null hypothesis is not rejected when it should have been. This means that the null hypothesis is accepted when it is actually false.
Type II errors are more likely to occur when the sample size is small, as there is less power in the statistical test to detect a true difference between the population and the sample. Recall from the previous unit that the power of a statistical test is the probability of correctly rejecting the null hypothesis when it is false.
Like the probability of a Type I error, the probability of a Type II error is influenced by the alpha level and the sample size. A higher alpha level and a larger sample size will result in a lower probability of making a Type II error. It is important to consider the consequences of making a Type II error, as failing to reject the null hypothesis when it is false can lead to incorrect conclusions being drawn about the population being studied.
Example
Let's say an author claims that the mean income for a given area is $45,000.
We sample a group of 50 families and find that the mean income of our sample is $38,000. In performing a statistical test, we would fail to reject the author's claim. If we made an error in our study (either due to sampling or by random chance), this would be a Type II error.
Question for Chapter Notes: Introducing Statistics: Should I Worry About Error?Try yourself: What is a Type I error?View Solution
How to Minimize Error in Statistical Studies
(1) Minimizing Error Due to Bias in Sampling
- Select a random sample using a method such as simple random sampling.
- Example: A band director wants to survey the school on their opinions of this year's half-time show. To perform the survey, he numbers each student in the school with a number and uses a random number generator to select 20 students. This is a GOOD example of how to select a random sample.
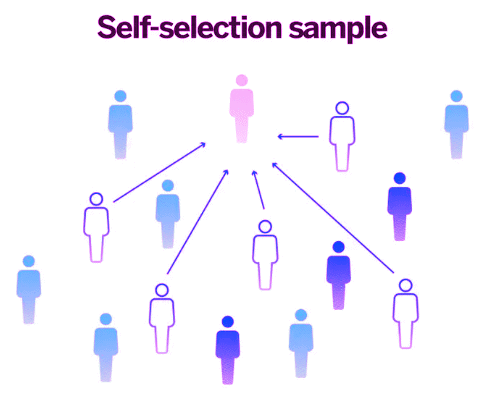
- Avoid volunteer samples, convenience samples, and other sampling methods that may heavily influence your data in one direction.
- Example: A band director wants to survey the school on their opinions of this year's half-time show. To perform the survey, he chooses the first 20 students who arrive at the Fall Band Concert and asks them if the band's show is satisfactory. This is a BAD example of how to select a random sample since he is only using students who were coming to the band concert (convenience sample).
(2) Minimizing Error Due to Bias in Questioning
- Avoid asking questions in a way that will prompt a certain response.
- Example: If the band director wants to know how the half-time show was, he should ask the question in a way such as "Rate the band's half-time show on a scale of 1-10" as opposed to saying, "Was the band's half-time show good?" The latter way of asking the question will likely influence the students to say "yes." This is known as response bias.
- Avoid having someone ask questions that may influence the response (for example, don't have a police officer ask someone if they have ever broken the speed limit).
- Example: If the band director wants to know how the half-time show was, an anonymous survey would be the best way. If the band director asked the students directly, they may feel more inclined to give it a higher rating (especially if their grade in class could be influenced by the way they feel).
(3) Minimizing Error Due to Confounding Variables
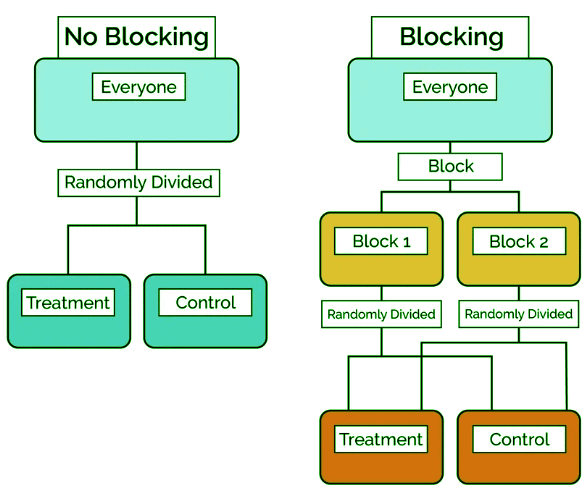
- Use blocking in your experiment to account for any known or suspected confounding variables.
- Example: If the band director wants to know how the student body feels about the half-time show, he may consider blocking by grade. That would ensure an equal amount of responses from each class and make sure that the age of students was not a confounding variable.
Question for Chapter Notes: Introducing Statistics: Should I Worry About Error?Try yourself: What is a good method for selecting a random sample?View Solution
Key Terms to Review
- Bias: Bias refers to a systematic error that leads to an incorrect or misleading representation of a population or phenomenon.
- Blocking: Blocking is a technique used in experimental design to reduce the impact of variability by grouping similar experimental units together.
- Confounding Variables: Confounding variables are factors that can obscure or distort the relationship between the independent and dependent variables in a study.
- Measurement Error: Measurement error refers to the difference between the actual value of a quantity and the value obtained through measurement.
- Random Sample: A random sample is a subset of individuals chosen from a larger population, where each individual has an equal chance of being selected.
- Sampling Error: Sampling error refers to the difference between the results obtained from a sample and the actual values that would be obtained if the entire population were measured.
- Simple Random Sampling: Simple random sampling is a method of selecting a subset of individuals from a larger population, where each individual has an equal chance of being chosen.
- Type II Error: A Type II error occurs when a statistical test fails to reject a false null hypothesis.
- Type I Error: A Type I Error occurs when a true null hypothesis is incorrectly rejected.
- Volunteer Samples: Volunteer samples are a type of non-probability sampling method where participants self-select to be part of a study.
The document Introducing Statistics: Should I Worry About Error? Chapter Notes | AP Statistics - Grade 9 is a part of the Grade 9 Course AP Statistics.
All you need of Grade 9 at this link: Grade 9
|
12 videos|106 docs|12 tests
|
FAQs on Introducing Statistics: Should I Worry About Error? Chapter Notes - AP Statistics - Grade 9
| 1. What is a Type I error and how does it occur? |  |
Ans. A Type I error, also known as a false positive, occurs when the null hypothesis is rejected when it should have been accepted. This typically happens when researchers conclude there is an effect or difference when there is none. The probability of making a Type I error is determined by the alpha level, commonly set at 0.05, indicating a 5% chance of committing this error.
| 2. What is a Type II error and what are its implications? | |
Ans. A Type II error, or false negative, occurs when the null hypothesis is not rejected when it should be. This means that researchers fail to detect a true effect or difference that exists. The risk of a Type II error can increase with small sample sizes, as there is less statistical power to identify significant differences.
| 3. How can researchers minimize errors in their statistical studies? | |
Ans. Researchers can minimize errors by implementing several strategies: (1) Use random sampling methods to avoid bias, (2) Phrase questions neutrally to reduce response bias, and (3) Use blocking techniques to account for confounding variables, ensuring that similar groups are compared to reduce variability in results.
| 4. What is the role of alpha level in statistical testing? | |
Ans. The alpha level, or significance level, defines the threshold for rejecting the null hypothesis. A common alpha level is 0.05, indicating a 5% risk of making a Type I error. Adjusting the alpha level affects both the likelihood of Type I errors and the power of the test, influencing the study's conclusions.
| 5. Why is random sampling important in statistical studies? | |
Ans. Random sampling is crucial because it ensures that every individual in the population has an equal chance of being selected, which helps to provide a representative sample. This reduces bias and increases the validity of the results, enabling more accurate conclusions about the population based on the sample data.
About this Document

Sep 02, 2025
Last updated
Related Exams
Document Description: Chapter Notes: Introducing Statistics: Should I Worry About Error? for Grade 9 2025 is part of AP Statistics preparation.
The notes and questions for Chapter Notes: Introducing Statistics: Should I Worry About Error? have been prepared according to the Grade 9 exam syllabus. Information about Chapter Notes: Introducing Statistics: Should I Worry About Error? covers topics
like Type I Errors and Chapter Notes: Introducing Statistics: Should I Worry About Error? Example, for Grade 9 2025 Exam. Find important definitions, questions, notes, meanings, examples, exercises and tests below for Chapter Notes: Introducing Statistics: Should I Worry About Error?.
Introduction of Chapter Notes: Introducing Statistics: Should I Worry About Error? in English is available as part of our AP Statistics
for Grade 9 & Chapter Notes: Introducing Statistics: Should I Worry About Error? in Hindi for AP Statistics course.
Download more important topics related with notes, lectures and mock test series for Grade 9
Exam by signing up for free. Grade 9: Introducing Statistics: Should I Worry About Error? Chapter Notes | AP Statistics - Grade 9
Description
Full syllabus notes, lecture & questions for Introducing Statistics: Should I Worry About Error? Chapter Notes | AP Statistics - Grade 9 - Grade 9 | Plus excerises question with solution to help you revise complete syllabus for AP Statistics | Best notes, free PDF download
Information about Chapter Notes: Introducing Statistics: Should I Worry About Error?
In this doc you can find the meaning of Chapter Notes: Introducing Statistics: Should I Worry About Error? defined & explained in the simplest way possible. Besides explaining types of
Chapter Notes: Introducing Statistics: Should I Worry About Error? theory, EduRev gives you an ample number of questions to practice Chapter Notes: Introducing Statistics: Should I Worry About Error? tests, examples and also practice Grade 9
tests

Related Searches
Exam
,Objective type Questions
,past year papers
,Introducing Statistics: Should I Worry About Error? Chapter Notes | AP Statistics - Grade 9
,Introducing Statistics: Should I Worry About Error? Chapter Notes | AP Statistics - Grade 9
,Semester Notes
,ppt
,practice quizzes
,Previous Year Questions with Solutions
,shortcuts and tricks
,Introducing Statistics: Should I Worry About Error? Chapter Notes | AP Statistics - Grade 9
,study material
,Sample Paper
,Free
,Extra Questions
,MCQs
,Summary
,Important questions
,video lectures
,mock tests for examination
,Viva Questions
;


Additional Information about Chapter Notes: Introducing Statistics: Should I Worry About Error? for Grade 9 Preparation
Chapter Notes: Introducing Statistics: Should I Worry About Error? Free PDF Download
The Chapter Notes: Introducing Statistics: Should I Worry About Error? is an invaluable resource that delves deep into the core of the Grade 9 exam.
These study notes are curated by experts and cover all the essential topics and concepts, making your preparation more efficient and effective.
With the help of these notes, you can grasp complex subjects quickly, revise important points easily,
and reinforce your understanding of key concepts. The study notes are presented in a concise and easy-to-understand manner,
allowing you to optimize your learning process. Whether you're looking for best-recommended books, sample papers, study material,
or toppers' notes, this PDF has got you covered. Download the Chapter Notes: Introducing Statistics: Should I Worry About Error? now and kickstart your journey towards success in the Grade 9 exam.
Importance of Chapter Notes: Introducing Statistics: Should I Worry About Error?
The importance of Chapter Notes: Introducing Statistics: Should I Worry About Error? cannot be overstated, especially for Grade 9 aspirants.
This document holds the key to success in the Grade 9 exam.
It offers a detailed understanding of the concept, providing invaluable insights into the topic.
By knowing the concepts well in advance, students can plan their preparation effectively.
Utilize this indispensable guide for a well-rounded preparation and achieve your desired results.
Chapter Notes: Introducing Statistics: Should I Worry About Error?
Chapter Notes: Introducing Statistics: Should I Worry About Error? Notes offer in-depth insights into the specific topic to help you master it with ease.
This comprehensive document covers all aspects related to Chapter Notes: Introducing Statistics: Should I Worry About Error?.
It includes detailed information about the exam syllabus, recommended books, and study materials for a well-rounded preparation.
Practice papers and question papers enable you to assess your progress effectively.
Additionally, the paper analysis provides valuable tips for tackling the exam strategically.
Access to Toppers' notes gives you an edge in understanding complex concepts.
Whether you're a beginner or aiming for advanced proficiency, Chapter Notes: Introducing Statistics: Should I Worry About Error? Notes on EduRev are your ultimate resource for success.
Chapter Notes: Introducing Statistics: Should I Worry About Error? Grade 9 Questions
The "Chapter Notes: Introducing Statistics: Should I Worry About Error? Grade 9 Questions" guide is a valuable resource for all aspiring students preparing for the
Grade 9 exam. It focuses on providing a wide range of practice questions to help students gauge
their understanding of the exam topics. These questions cover the entire syllabus, ensuring comprehensive preparation.
The guide includes previous years' question papers for students to familiarize themselves with the exam's format and difficulty level.
Additionally, it offers subject-specific question banks, allowing students to focus on weak areas and improve their performance.
Study Chapter Notes: Introducing Statistics: Should I Worry About Error? on the App
Students of Grade 9 can study Chapter Notes: Introducing Statistics: Should I Worry About Error? alongwith tests & analysis from the EduRev app,
which will help them while preparing for their exam. Apart from the Chapter Notes: Introducing Statistics: Should I Worry About Error?,
students can also utilize the EduRev App for other study materials such as previous year question papers, syllabus, important questions, etc.
The EduRev App will make your learning easier as you can access it from anywhere you want.
The content of Chapter Notes: Introducing Statistics: Should I Worry About Error? is prepared as per the latest Grade 9 syllabus.
|
© EduRev
|
Education Revolution
|


|


Signup to see your scores
go up within 7 days!
Access 1000+ FREE Docs, Videos and Tests
Takes less than 10 seconds to signup