Grade 9 Exam > Grade 9 Notes > AP Statistics > Chapter Notes: Expected Counts in Two Way Tables
Expected Counts in Two Way Tables Chapter Notes | AP Statistics - Grade 9 PDF Download

Tests from Two-Way Tables
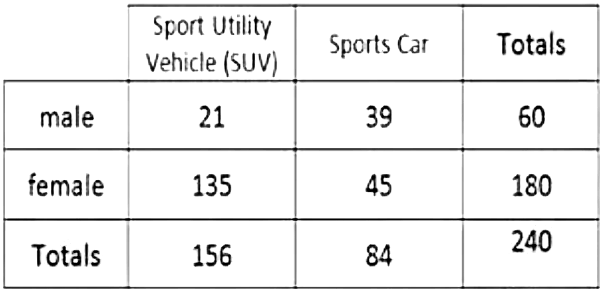
Another form of data that we can use χ² tests for involves data from a two-way table (like the one pictured below).
When performing a χ² test from a two-way table, there are two different tests we may have to perform, and choosing which one can be tricky.
Test for Homogeneity
A chi-squared test for homogeneity is used to compare the distribution of a categorical variable between two or more independent groups or populations. It tests the null hypothesis that the proportions of the categories are the same in all the groups. In other words, we'll use the chi-squared test for homogeneity when we're comparing two different populations to see if they have different amounts for a given categorical variable.
Test for Independence
A chi-squared test for independence is used to examine the relationship between two categorical variables in a single population. It tests the null hypothesis that the two variables are independent, meaning that the presence or absence of one variable does not affect the probability of the other variable. In other words, we'll use this test when we're comparing within one population to see if two categorical variables are associated.
Expected Counts
Regardless of which test we are doing, we will be comparing two multi-row/column matrices rather than just two rows or columns. This means we have to calculate the expected counts matrix based on our observed counts table. This will be done by doing the following for each cell:
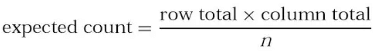
Where n = table total.
Example
In the first cell of the two-way table above on SUV and sports car ownership in regard to male or female, we would take the total male (60) and the total SUV (156), multiply those to get 9360. Then we would divide that total by our table total (240) and get 39. We would complete this process for all cells to create our expected count table.
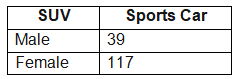
Our final expected counts answer would be:
Applications
In the next sections, we will talk about setting up the two types of χ² tests regarding a two-way table and how we will use these observed and expected counts to determine if we have an association or homogeneity between our two variables/populations. Stay tuned 'til then!
Question for Chapter Notes: Expected Counts in Two Way TablesTry yourself: What does a chi-squared test for homogeneity compare?View Solution
Key Terms to Review
- Chi-Squared Test for Homogeneity: A statistical method used to determine if two or more populations have the same distribution for a categorical variable.
- Chi-Squared Test for Independence: A statistical method used to determine whether there is a significant association between two categorical variables.
- Expected Counts: The predicted frequencies of occurrences in a contingency table under the assumption of independence or homogeneity.
- Proportions: Represent a part of a whole, typically expressed as a fraction or percentage, crucial for comparing different groups.
- Test for Independence: A method used to determine whether there is a significant association between two categorical variables.
- χ² tests: Statistical methods used to determine whether there is a significant association between categorical variables.
The document Expected Counts in Two Way Tables Chapter Notes | AP Statistics - Grade 9 is a part of the Grade 9 Course AP Statistics.
All you need of Grade 9 at this link: Grade 9
|
12 videos|106 docs|12 tests
|
FAQs on Expected Counts in Two Way Tables Chapter Notes - AP Statistics - Grade 9
| 1. What are expected counts in a two-way table? |  |
Ans.Expected counts are the theoretical frequencies that we would expect to see in each cell of a two-way table if there were no association between the two categorical variables. They are calculated based on the marginal totals of the rows and columns.
| 2. How do you calculate expected counts in a two-way table? | |
Ans.To calculate expected counts, you use the formula: (Row total * Column total) / Grand total. This gives you the expected frequency for each cell in the table.
| 3. Why are expected counts important in statistical analysis? | |
Ans.Expected counts are important because they are used to determine whether there is a significant association between the two categorical variables. They help in conducting chi-square tests, which assess how far the observed counts deviate from the expected counts.
| 4. What is the minimum expected count requirement for a chi-square test? | |
Ans.The general rule is that each expected count should be 5 or more to ensure the validity of the chi-square test results. If any expected count is less than 5, it may lead to inaccurate conclusions.
| 5. How can I interpret the results of a chi-square test using expected counts? | |
Ans.When you interpret the results of a chi-square test, you compare the chi-square statistic to a critical value from the chi-square distribution. If the observed counts significantly deviate from the expected counts, it indicates a potential association between the variables being analyzed.
About this Document

Sep 04, 2025
Last updated
Document Description: Chapter Notes: Expected Counts in Two Way Tables for Grade 9 2025 is part of AP Statistics preparation.
The notes and questions for Chapter Notes: Expected Counts in Two Way Tables have been prepared according to the Grade 9 exam syllabus. Information about Chapter Notes: Expected Counts in Two Way Tables covers topics
like and Chapter Notes: Expected Counts in Two Way Tables Example, for Grade 9 2025 Exam. Find important definitions, questions, notes, meanings, examples, exercises and tests below for Chapter Notes: Expected Counts in Two Way Tables.
Introduction of Chapter Notes: Expected Counts in Two Way Tables in English is available as part of our AP Statistics
for Grade 9 & Chapter Notes: Expected Counts in Two Way Tables in Hindi for AP Statistics course.
Download more important topics related with notes, lectures and mock test series for Grade 9
Exam by signing up for free. Grade 9: Expected Counts in Two Way Tables Chapter Notes | AP Statistics - Grade 9
Description
Full syllabus notes, lecture & questions for Expected Counts in Two Way Tables Chapter Notes | AP Statistics - Grade 9 - Grade 9 | Plus excerises question with solution to help you revise complete syllabus for AP Statistics | Best notes, free PDF download
Information about Chapter Notes: Expected Counts in Two Way Tables
In this doc you can find the meaning of Chapter Notes: Expected Counts in Two Way Tables defined & explained in the simplest way possible. Besides explaining types of
Chapter Notes: Expected Counts in Two Way Tables theory, EduRev gives you an ample number of questions to practice Chapter Notes: Expected Counts in Two Way Tables tests, examples and also practice Grade 9
tests

Related Searches
Exam
,Previous Year Questions with Solutions
,video lectures
,Sample Paper
,mock tests for examination
,Important questions
,Viva Questions
,past year papers
,Summary
,Expected Counts in Two Way Tables Chapter Notes | AP Statistics - Grade 9
,MCQs
,Free
,shortcuts and tricks
,study material
,Objective type Questions
,ppt
,Semester Notes
,practice quizzes
,Expected Counts in Two Way Tables Chapter Notes | AP Statistics - Grade 9
,Expected Counts in Two Way Tables Chapter Notes | AP Statistics - Grade 9
,Extra Questions
;


Additional Information about Chapter Notes: Expected Counts in Two Way Tables for Grade 9 Preparation
Chapter Notes: Expected Counts in Two Way Tables Free PDF Download
The Chapter Notes: Expected Counts in Two Way Tables is an invaluable resource that delves deep into the core of the Grade 9 exam.
These study notes are curated by experts and cover all the essential topics and concepts, making your preparation more efficient and effective.
With the help of these notes, you can grasp complex subjects quickly, revise important points easily,
and reinforce your understanding of key concepts. The study notes are presented in a concise and easy-to-understand manner,
allowing you to optimize your learning process. Whether you're looking for best-recommended books, sample papers, study material,
or toppers' notes, this PDF has got you covered. Download the Chapter Notes: Expected Counts in Two Way Tables now and kickstart your journey towards success in the Grade 9 exam.
Importance of Chapter Notes: Expected Counts in Two Way Tables
The importance of Chapter Notes: Expected Counts in Two Way Tables cannot be overstated, especially for Grade 9 aspirants.
This document holds the key to success in the Grade 9 exam.
It offers a detailed understanding of the concept, providing invaluable insights into the topic.
By knowing the concepts well in advance, students can plan their preparation effectively.
Utilize this indispensable guide for a well-rounded preparation and achieve your desired results.
Chapter Notes: Expected Counts in Two Way Tables
Chapter Notes: Expected Counts in Two Way Tables Notes offer in-depth insights into the specific topic to help you master it with ease.
This comprehensive document covers all aspects related to Chapter Notes: Expected Counts in Two Way Tables.
It includes detailed information about the exam syllabus, recommended books, and study materials for a well-rounded preparation.
Practice papers and question papers enable you to assess your progress effectively.
Additionally, the paper analysis provides valuable tips for tackling the exam strategically.
Access to Toppers' notes gives you an edge in understanding complex concepts.
Whether you're a beginner or aiming for advanced proficiency, Chapter Notes: Expected Counts in Two Way Tables Notes on EduRev are your ultimate resource for success.
Chapter Notes: Expected Counts in Two Way Tables Grade 9 Questions
The "Chapter Notes: Expected Counts in Two Way Tables Grade 9 Questions" guide is a valuable resource for all aspiring students preparing for the
Grade 9 exam. It focuses on providing a wide range of practice questions to help students gauge
their understanding of the exam topics. These questions cover the entire syllabus, ensuring comprehensive preparation.
The guide includes previous years' question papers for students to familiarize themselves with the exam's format and difficulty level.
Additionally, it offers subject-specific question banks, allowing students to focus on weak areas and improve their performance.
Study Chapter Notes: Expected Counts in Two Way Tables on the App
Students of Grade 9 can study Chapter Notes: Expected Counts in Two Way Tables alongwith tests & analysis from the EduRev app,
which will help them while preparing for their exam. Apart from the Chapter Notes: Expected Counts in Two Way Tables,
students can also utilize the EduRev App for other study materials such as previous year question papers, syllabus, important questions, etc.
The EduRev App will make your learning easier as you can access it from anywhere you want.
The content of Chapter Notes: Expected Counts in Two Way Tables is prepared as per the latest Grade 9 syllabus.
|
© EduRev
|
Education Revolution
|


|


Signup on EduRev and stay on top of your study goals
10M+ students crushing their study goals daily