Constructing a Confidence Interval for a Population Mean Chapter Notes | AP Statistics - Grade 9 PDF Download
| Table of contents |
|
| Conditions for Inference |
|
| Formula |
|
| Meaning of Confidence Interval |
|
| Interpretation |
|

The t-distribution is a continuous probability distribution used to estimate population parameters when the sample size is small and the population variance is unknown. It is similar to the normal distribution but has heavier tails, meaning there is a higher likelihood for observations to fall in the extreme tails of the distribution. This accounts for the additional uncertainty introduced by estimating the population variance from the sample variance.
Conditions for Inference
Before proceeding to calculate a confidence interval, we must check that our sampling distribution meets certain conditions:
Random Sample
- This reduces any bias that may arise from taking a bad sample.
- It is essential to note that our sample was random, either by highlighting text on the exam or quoting the problem detailing its randomness.
Independence
- This ensures that each subject in our sample was not influenced by the previous subjects chosen.
- If our sample size is not close to our population size, we can conclude that the effect on our sampling is negligible.
- Check if it is reasonable to believe that the population is at least 10 times the sample size (10n).
For example, if we have a random sample of 85 teenagers' math grades and are creating a confidence interval for the average of all teenagers' math grades, we could state, "It is reasonable to believe that there are at least 850 teenagers currently enrolled in a math class."
Normal
- This check verifies that we can use a normal curve to calculate probabilities using either the empirical rule or z scores.
- We can verify that a sampling distribution is normal using the Central Limit Theorem, which states that if our sample size is at least 30, we can assume the sampling distribution will be approximately normal.
In our example with 85 teenagers, we can assume that the sampling distribution of their grades will be normal because 85 > 30.
Formula
A confidence interval consists of two parts: a point estimate and a margin of error.
Point Estimate
A point estimate is a single value used to estimate a population parameter. For instance, if trying to estimate the mean of a population, the point estimate would be the sample mean (𝑥̄).
The confidence interval is calculated based on the sample mean and the standard error of the mean, constructed to provide a specified level of confidence (e.g., 95%) that the population mean falls within the interval.
Margin of Error
The margin of error can be thought of as a "buffer zone." It is the amount added and subtracted to our sample mean to account for error in estimating our population mean. It consists of two parts:
- Critical Value
- Standard Error
The critical value is the t-score based on the mean and standard deviation of the sampling distribution, along with the degrees of freedom. Degrees of freedom can be calculated by taking the sample size and subtracting one. A critical value can be determined using a calculator's inverse T function or charts on the College Board formula sheet.
Meaning of Confidence Interval
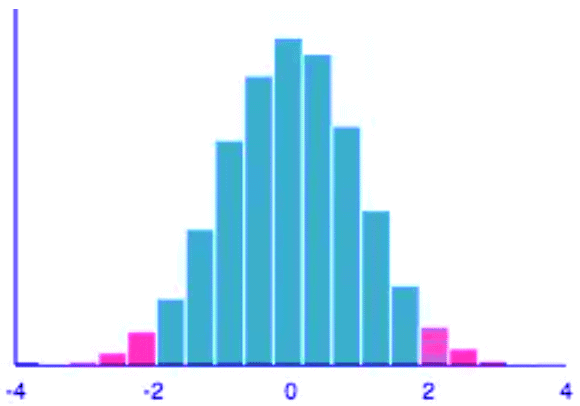
A confidence interval is a range of values that we believe the true population mean will fall between. For example, with a sample mean of 0, sample standard deviation of 10, and sample size of 100, a 95% confidence interval suggests that the true population mean is likely between -2 and 2.
Interpretation
On the AP exam, you are typically asked to create and interpret a confidence interval.
When interpreting your interval for a population mean, use the following template:
"I am % confident that the true population mean of ______________ is between ( , ___)."
Rubrics generally include the following three aspects:
- Confidence level
- Context of problem
- Demonstration of knowledge that we are inferring about the true population mean
Key Terms to Review
- Central Limit Theorem: States that the sampling distribution of the sample mean approaches a normal distribution as the sample size increases, regardless of the population's distribution.
- Confidence Interval: A range of values derived from sample statistics that is likely to contain the true value of an unknown population parameter, with a specified level of confidence.
- Critical Value: A point on the scale of the test statistic that is compared to the test statistic to determine whether to reject the null hypothesis.
- Degrees of freedom (df): Refers to the number of independent values that can vary in a statistical calculation without violating constraints.
- Empirical Rule: States that for a normal distribution, approximately 68% fall within one standard deviation, 95% within two, and 99.7% within three.
- Heavier Tails: Refers to a distribution's propensity for extreme values to occur more frequently than predicted by a normal distribution.
- Independence: The occurrence of one event does not affect the occurrence of another.
- Inverse T Function: Used to determine the critical value from the t-distribution corresponding to a given probability level and degrees of freedom.
- Margin of Error: Quantifies the uncertainty associated with a sample estimate.
- Normal Distribution: A continuous probability distribution characterized by a symmetric, bell-shaped curve.
- Population Variance: Measures the degree of spread of data points in a population relative to the population mean.
- Sample Size: Number of observations collected from a population for statistical analysis.
- Sample Variance: Measures the dispersion of a set of sample data points around their mean.
- Standard Error: Quantifies the variability of a sample mean from the population mean.
|
12 videos|106 docs|12 tests
|
FAQs on Constructing a Confidence Interval for a Population Mean Chapter Notes - AP Statistics - Grade 9
| 1. What is a confidence interval and why is it important in statistics? |  |
| 2. How do I determine if my sample meets the conditions for constructing a confidence interval? | |
| 3. What is the difference between a point estimate and a margin of error? | |
| 4. How do I interpret a confidence interval? | |
| 5. What is the Central Limit Theorem and why is it relevant to confidence intervals? | |


Extra Questions
,practice quizzes
,MCQs
,Constructing a Confidence Interval for a Population Mean Chapter Notes | AP Statistics - Grade 9
,past year papers
,Exam
,Free
,Previous Year Questions with Solutions
,Constructing a Confidence Interval for a Population Mean Chapter Notes | AP Statistics - Grade 9
,shortcuts and tricks
,mock tests for examination
,Important questions
,Sample Paper
,ppt
,Summary
,study material
,Semester Notes
,Constructing a Confidence Interval for a Population Mean Chapter Notes | AP Statistics - Grade 9
,Objective type Questions
,video lectures
,Viva Questions
;


Chapter Notes: Constructing a Confidence Interval for a Population Mean Free PDF Download
Importance of Chapter Notes: Constructing a Confidence Interval for a Population Mean
Chapter Notes: Constructing a Confidence Interval for a Population Mean
Chapter Notes: Constructing a Confidence Interval for a Population Mean Grade 9 Questions
Study Chapter Notes: Constructing a Confidence Interval for a Population Mean on the App
|
© EduRev
|
Education Revolution
|


|


