Grade 9 Exam > Grade 9 Notes > AP Statistics > Chapter Notes: Confidence Intervals for the Difference of Two Means
Confidence Intervals for the Difference of Two Means Chapter Notes | AP Statistics - Grade 9 PDF Download

Sometimes in statistical studies, it is important to compare two different populations to see if they are different. For instance, what if we want to compare the weights of two types of apples:  ? Perhaps we believe that the weight of
  is more than
  or maybe we just think they are different. Either way, we have the statistical means to check if the weights are different or if one weighs more than the other. One option of comparing these two populations is to create a confidence interval for the difference of two population means.
Conditions
As with any act of statistical inference, we must check our conditions for inference prior to performing any calculations.
Random
It is absolutely essential that your samples come from a randomized process since we seek to infer things about a population. Since we are dealing with two populations, both samples must be random. If you are performing an experiment to check the difference in two populations, you must verify that both samples were randomly assigned to treatments.
Independent
Since we are generally sampling without replacement, we must check to be sure that the samples are independent. We can use this by checking the 10% condition for both samples. NOTE: If doing an experiment, it is not necessary to check the 10% condition. A randomized experiment is sufficient for independence.
Normal
To check normality of a sampling distribution for the difference in two population means, we have to ensure that both samples have approximately normal sampling distributions. This can be done using the Central Limit Theorem (n ≥ 30), verifying that both populations are normally distributed, or by checking that box plots of both samples show no strong skewness or apparent outliers.
Calculations
To calculate a confidence interval for the difference in two population means, we must first calculate our point estimate and margin of error.
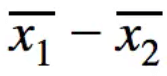
Point Estimate
Our point estimate is what we believe the difference between the two populations is, based on our sample means. To find this, we simply subtract our two sample means.
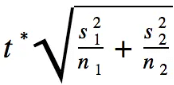
Margin of Error
Our margin of error is what we add/subtract to our point estimate to create our confidence interval. For a confidence interval for the difference of two population means, the formula for margin of error is below:
Calculator Commands
A much easier, more efficient way of calculating a confidence interval for the difference in two population means is to use technology such as a graphing calculator. On a TI-84, you would start by going into the stats menu, scrolling to test and selecting 2 Sample T Interval, where you would input the given statistics to calculate the confidence interval.
Example
Let's say that we have a bag of green apples and a bag of red apples and we want to estimate the difference in population means of the two types of apples. Our sample of 30
 s weighs a mean of 5 oz with a standard deviation of 0.2 oz, and our sample of 30
  s weighs a mean of 4.5 oz with a standard deviation of 0.15 oz. Create and interpret a confidence interval for the difference in the two population means of the weights of green apples and red apples.
The easiest way to construct your interval is to use technology such as a graphing calculator:
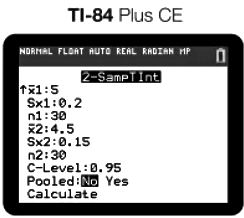 We always select not pooled when doing two sample intervals and tests because we do not know if the populations have equal variances. After calculating, we get the following interval: (0.408, 0.592).
Question for Chapter Notes: Confidence Intervals for the Difference of Two MeansTry yourself: What must be true for samples when comparing two populations?View Solution
Key Terms to Review
- 2 Sample T Interval: A statistical method used to estimate the confidence interval for the difference between the means of two independent groups.
- Central Limit Theorem: States that the sampling distribution of the sample mean approaches a normal distribution as the sample size increases.
- Confidence Interval: A range of values derived from sample statistics that is likely to contain the true value of an unknown population parameter.
- Independent Events: Two or more events that do not influence each other's occurrence.
- Margin of Error: Quantifies the uncertainty associated with a sample estimate.
- Not Pooled: Refers to a statistical approach where the variances of two populations are considered unequal.
- Point Estimate: A single value that serves as an approximation of a population parameter.
- Standard Deviation: A measure of the amount of variation or dispersion in a set of values.
The document Confidence Intervals for the Difference of Two Means Chapter Notes | AP Statistics - Grade 9 is a part of the Grade 9 Course AP Statistics.
All you need of Grade 9 at this link: Grade 9
|
12 videos|106 docs|12 tests
|
FAQs on Confidence Intervals for the Difference of Two Means Chapter Notes - AP Statistics - Grade 9
| 1. What are the conditions that must be met before calculating a confidence interval for the difference of two means? |  |
Ans. The conditions that must be met include: (1) Random: Both samples must come from a randomized process. (2) Independent: The samples should be independent, which can be checked using the 10% condition if sampling without replacement. (3) Normal: The sampling distributions should be approximately normal, which can be ensured by having sample sizes of at least 30, verifying that populations are normally distributed, or checking for skewness and outliers in box plots.
| 2. How do you calculate the point estimate for the difference of two means? | |
Ans. The point estimate is calculated by subtracting the mean of the second sample from the mean of the first sample. It represents the estimated difference between the two population means based on the sample data.
| 3. What is the formula for margin of error when calculating a confidence interval for the difference of two means? | |
Ans. The margin of error for the difference of two population means is calculated based on the standard error of the difference and the critical value from the t-distribution corresponding to the desired level of confidence.
| 4. Why should you select "not pooled" when calculating the confidence interval for two sample means? | |
Ans. You should select "not pooled" because we typically do not know if the populations have equal variances. Using the not pooled approach allows for a more accurate estimation of the confidence interval by accounting for the possibility that the variances are unequal.
| 5. How can technology assist in calculating a confidence interval for the difference of two means? | |
Ans. Technology, such as a graphing calculator like the TI-84, can simplify the calculation process. By navigating to the stats menu and selecting the 2 Sample T Interval option, you can input the necessary statistics, and the calculator will compute the confidence interval efficiently.
About this Document

Sep 02, 2025
Last updated
Related Exams
Document Description: Chapter Notes: Confidence Intervals for the Difference of Two Means for Grade 9 2025 is part of AP Statistics preparation.
The notes and questions for Chapter Notes: Confidence Intervals for the Difference of Two Means have been prepared according to the Grade 9 exam syllabus. Information about Chapter Notes: Confidence Intervals for the Difference of Two Means covers topics
like Conditions, Calculations and Chapter Notes: Confidence Intervals for the Difference of Two Means Example, for Grade 9 2025 Exam. Find important definitions, questions, notes, meanings, examples, exercises and tests below for Chapter Notes: Confidence Intervals for the Difference of Two Means.
Introduction of Chapter Notes: Confidence Intervals for the Difference of Two Means in English is available as part of our AP Statistics
for Grade 9 & Chapter Notes: Confidence Intervals for the Difference of Two Means in Hindi for AP Statistics course.
Download more important topics related with notes, lectures and mock test series for Grade 9
Exam by signing up for free. Grade 9: Confidence Intervals for the Difference of Two Means Chapter Notes | AP Statistics - Grade 9
Description
Full syllabus notes, lecture & questions for Confidence Intervals for the Difference of Two Means Chapter Notes | AP Statistics - Grade 9 - Grade 9 | Plus excerises question with solution to help you revise complete syllabus for AP Statistics | Best notes, free PDF download
Information about Chapter Notes: Confidence Intervals for the Difference of Two Means
In this doc you can find the meaning of Chapter Notes: Confidence Intervals for the Difference of Two Means defined & explained in the simplest way possible. Besides explaining types of
Chapter Notes: Confidence Intervals for the Difference of Two Means theory, EduRev gives you an ample number of questions to practice Chapter Notes: Confidence Intervals for the Difference of Two Means tests, examples and also practice Grade 9
tests

Related Searches
past year papers
,practice quizzes
,Summary
,Viva Questions
,Previous Year Questions with Solutions
,Semester Notes
,Important questions
,Sample Paper
,Extra Questions
,Confidence Intervals for the Difference of Two Means Chapter Notes | AP Statistics - Grade 9
,Free
,mock tests for examination
,Exam
,Confidence Intervals for the Difference of Two Means Chapter Notes | AP Statistics - Grade 9
,ppt
,shortcuts and tricks
,study material
,video lectures
,Confidence Intervals for the Difference of Two Means Chapter Notes | AP Statistics - Grade 9
,MCQs
,Objective type Questions
;


Additional Information about Chapter Notes: Confidence Intervals for the Difference of Two Means for Grade 9 Preparation
Chapter Notes: Confidence Intervals for the Difference of Two Means Free PDF Download
The Chapter Notes: Confidence Intervals for the Difference of Two Means is an invaluable resource that delves deep into the core of the Grade 9 exam.
These study notes are curated by experts and cover all the essential topics and concepts, making your preparation more efficient and effective.
With the help of these notes, you can grasp complex subjects quickly, revise important points easily,
and reinforce your understanding of key concepts. The study notes are presented in a concise and easy-to-understand manner,
allowing you to optimize your learning process. Whether you're looking for best-recommended books, sample papers, study material,
or toppers' notes, this PDF has got you covered. Download the Chapter Notes: Confidence Intervals for the Difference of Two Means now and kickstart your journey towards success in the Grade 9 exam.
Importance of Chapter Notes: Confidence Intervals for the Difference of Two Means
The importance of Chapter Notes: Confidence Intervals for the Difference of Two Means cannot be overstated, especially for Grade 9 aspirants.
This document holds the key to success in the Grade 9 exam.
It offers a detailed understanding of the concept, providing invaluable insights into the topic.
By knowing the concepts well in advance, students can plan their preparation effectively.
Utilize this indispensable guide for a well-rounded preparation and achieve your desired results.
Chapter Notes: Confidence Intervals for the Difference of Two Means
Chapter Notes: Confidence Intervals for the Difference of Two Means Notes offer in-depth insights into the specific topic to help you master it with ease.
This comprehensive document covers all aspects related to Chapter Notes: Confidence Intervals for the Difference of Two Means.
It includes detailed information about the exam syllabus, recommended books, and study materials for a well-rounded preparation.
Practice papers and question papers enable you to assess your progress effectively.
Additionally, the paper analysis provides valuable tips for tackling the exam strategically.
Access to Toppers' notes gives you an edge in understanding complex concepts.
Whether you're a beginner or aiming for advanced proficiency, Chapter Notes: Confidence Intervals for the Difference of Two Means Notes on EduRev are your ultimate resource for success.
Chapter Notes: Confidence Intervals for the Difference of Two Means Grade 9 Questions
The "Chapter Notes: Confidence Intervals for the Difference of Two Means Grade 9 Questions" guide is a valuable resource for all aspiring students preparing for the
Grade 9 exam. It focuses on providing a wide range of practice questions to help students gauge
their understanding of the exam topics. These questions cover the entire syllabus, ensuring comprehensive preparation.
The guide includes previous years' question papers for students to familiarize themselves with the exam's format and difficulty level.
Additionally, it offers subject-specific question banks, allowing students to focus on weak areas and improve their performance.
Study Chapter Notes: Confidence Intervals for the Difference of Two Means on the App
Students of Grade 9 can study Chapter Notes: Confidence Intervals for the Difference of Two Means alongwith tests & analysis from the EduRev app,
which will help them while preparing for their exam. Apart from the Chapter Notes: Confidence Intervals for the Difference of Two Means,
students can also utilize the EduRev App for other study materials such as previous year question papers, syllabus, important questions, etc.
The EduRev App will make your learning easier as you can access it from anywhere you want.
The content of Chapter Notes: Confidence Intervals for the Difference of Two Means is prepared as per the latest Grade 9 syllabus.
|
© EduRev
|
Education Revolution
|


|


Signup on EduRev and stay on top of your study goals
10M+ students crushing their study goals daily