Carrying Out a Test for the Difference of Two Population Means Chapter Notes | AP Statistics - Grade 9 PDF Download

Overview of the Two-Sample T-Test
Once you've confirmed that the assumptions for a two-sample t-test are satisfied, you can proceed to evaluate whether the difference between two population means is statistically significant. This involves computing the test statistic and determining the p-value, which helps assess whether the observed difference between sample means is likely due to chance.
Steps for Conducting the Test
Calculating the Test Statistic
To compute the test statistic for a two-sample t-test, follow these steps:
- Find the difference between the two sample means (mean1 - mean2).
- Calculate the standard error of the difference, which accounts for the standard deviations and sample sizes of both groups.
- Divide the difference by the standard error to obtain the t-score.
The formula for the t-score, specific to comparing two population means, is simplified as:
t = (mean1 - mean2) / sqrt((s1²/n1) + (s2²/n2))
This formula is available on the AP Statistics Formula Sheet, adjusted for the two-sample case.
Determining Degrees of Freedom
Degrees of freedom (df) are essential for interpreting the t-score:
- Manual Calculation: Take the smaller of the two sample sizes and subtract 1 (similar to single-sample t-tests in Unit 7.5).
- Using Technology: When using a graphing calculator or statistical software, the degrees of freedom are provided in the output.
Critical Value (t-score)
To calculate our critical value, we used the typical formula:
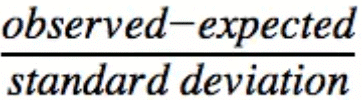 To make it more specific for a t-score with the difference of two population means, our formula simplifies to:
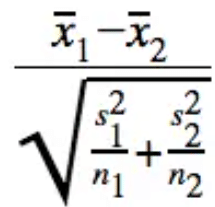
Finding the P-Value
The p-value indicates the probability that the observed difference between sample means occurred by random chance. To find it:
- Manual Approach: Use a t-table with the calculated degrees of freedom. Locate the row for your df and find the t-score closest to your calculated value. The corresponding tail probability is an approximate p-value.
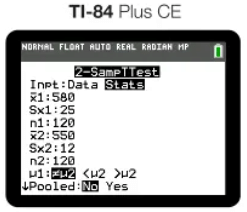
- Technology Approach: Perform a two-sample t-test using a graphing calculator or software. Input either the summary statistics (means, standard deviations, sample sizes) or raw data in lists. The output will include the t-score, degrees of freedom, and p-value.
 And our output would be as follows:
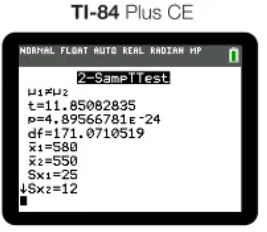
AP Exam Tip: Always report the t-score, degrees of freedom, and p-value in your response to earn full credit.
Testing the Statistical Claim
Compare the p-value to the significance level (typically α = 0.05):
- If the p-value is less than the significance level, reject the null hypothesis. This suggests strong evidence supporting the alternative hypothesis.
- If the p-value is greater than or equal to the significance level, fail to reject the null hypothesis, indicating insufficient evidence to support a difference.
Example: Green Bean Fields
Consider a scenario from Unit 7.8 where we compare the mean number of green beans picked from two fields (Field A and Field B). After performing a two-sample t-test, suppose the output is:
- t-score: [calculated value]
- Degrees of freedom: [calculated df]
- P-value: ~0.000
Conclusion: Since the p-value (~0.000) is less than 0.05, we reject the null hypothesis. There is convincing evidence that the true mean number of green beans picked from Field A differs from that of Field B. This conclusion is contextualized to the problem, compares the p-value to the significance level, and clearly states the decision regarding the null and alternative hypotheses.
Key Terms to Understand
- Alternate Hypothesis: A statement proposing a difference, effect, or relationship in a statistical test, contrasting the null hypothesis. It guides the test by suggesting there is an effect worth investigating.
- Degrees of Freedom: The number of independent values that can vary in a statistical calculation without violating constraints. It affects the distribution of the test statistic and is critical for hypothesis tests and confidence intervals.
- Null Hypothesis: A baseline assumption that there is no effect or difference in the population, used as a starting point for statistical testing.
- Significance Level (α): The threshold (e.g., 0.05) for deciding whether to reject the null hypothesis, representing the probability of a Type I error (false positive).
- Standard Error: A measure of how accurately a sample mean represents the population mean, quantifying variability. It is used in hypothesis tests and confidence intervals to assess precision.
- Statistical Significance: The likelihood that an observed result is not due to chance, determined by comparing the p-value to the significance level. A significant result supports rejecting the null hypothesis.
- Type I Error: Incorrectly rejecting a true null hypothesis, also known as a false positive, indicating a nonexistent effect or difference.
- Type II Error: Failing to reject a false null hypothesis, missing a true effect or difference in the population.
- Two-Sample T-Test: A statistical test to compare the means of two independent groups, assuming normal distribution and similar variances in the populations.
|
12 videos|106 docs|12 tests
|
FAQs on Carrying Out a Test for the Difference of Two Population Means Chapter Notes - AP Statistics - Grade 9
| 1. What is a Two-Sample T-Test ? |  |
| 2. When should I use a Two-Sample T-Test ? | |
| 3. What are the assumptions of the Two-Sample T-Test ? | |
| 4. How do I interpret the results of a Two-Sample T-Test ? | |
| 5. What is the difference between a Two-Sample T-Test and a Paired T-Test ? | |


shortcuts and tricks
,ppt
,Free
,Carrying Out a Test for the Difference of Two Population Means Chapter Notes | AP Statistics - Grade 9
,study material
,video lectures
,Important questions
,Semester Notes
,Previous Year Questions with Solutions
,past year papers
,practice quizzes
,mock tests for examination
,Exam
,Objective type Questions
,Viva Questions
,Sample Paper
,Carrying Out a Test for the Difference of Two Population Means Chapter Notes | AP Statistics - Grade 9
,Carrying Out a Test for the Difference of Two Population Means Chapter Notes | AP Statistics - Grade 9
,Summary
,Extra Questions
,MCQs
;


Chapter Notes: Carrying Out a Test for the Difference of Two Population Means Free PDF Download
Importance of Chapter Notes: Carrying Out a Test for the Difference of Two Population Means
Chapter Notes: Carrying Out a Test for the Difference of Two Population Means
Chapter Notes: Carrying Out a Test for the Difference of Two Population Means Grade 9 Questions
Study Chapter Notes: Carrying Out a Test for the Difference of Two Population Means on the App
|
© EduRev
|
Education Revolution
|


|


within 7 days!