Carrying Out a Test for a Population Mean Chapter Notes | AP Statistics - Grade 9 PDF Download
| Table of contents |
|
| Calculating the T-Score |
|
| Determining the P-Value |
|
| Using a Calculator for T-Score and P-Value |
|
| Making Conclusions with the P-Value |
|

Calculating the T-Score
To perform a statistical significance test for a population mean, the first step is to compute the t-score, the test statistic used in a t-test. The t-score measures how significantly the sample mean differs from a hypothesized population mean.
The formula for the t-score is derived by dividing the difference between the sample mean and the hypothesized mean by the standard error of the mean. The standard error of the mean reflects the variability of the sample mean and is calculated as the sample standard deviation divided by the square root of the sample size.
A larger t-score indicates a more significant difference between the sample mean and the hypothesized mean. The general formula for the t-score is:
t = (x̄ - μ) / (s / √n)
Where:
- x̄: Sample mean
- μ: Hypothesized population mean
- s: Sample standard deviation
- n: Sample size
Example
Ricardo has a bag of 30 oranges, with the label claiming an average weight of 4.5 oz per orange. After weighing all the oranges, Ricardo finds an average weight of 4.65 oz with a standard deviation of 0.8 oz.
Using the t-score formula:
t = (4.65 - 4.5) / (0.8 / √30) ≈ 1.027
Determining the P-Value
Hypothesis tests can be one-tailed or two-tailed, depending on the alternative hypothesis. A one-tailed test is used when the alternative hypothesis specifies a direction (e.g., "the population mean is greater than 4.5 oz"). In this case, the t-score is evaluated in one tail of the t-distribution. A two-tailed test is used for a non-directional hypothesis (e.g., "the population mean is not equal to 4.5 oz"), evaluating the t-score in both tails.
One-tailed tests are more powerful for detecting differences in a specific direction but increase the risk of a Type I error (incorrectly rejecting a true null hypothesis). Two-tailed tests are less powerful but reduce this risk by not favoring a specific direction.
To find the p-value, use a t-distribution table. First, calculate the degrees of freedom (df), which is the sample size minus one (df = n - 1). Then, locate the t-score in the t-table under the corresponding df to estimate the p-value. If the exact df is not listed, round down to the nearest available df.
Example (Continued)
For Ricardo’s oranges, with a sample size of 30, the degrees of freedom are df = 30 - 1 = 29. Using a t-table, a t-score of 1.027 with 29 df corresponds to a tail probability of approximately 0.15 (close to 1.055).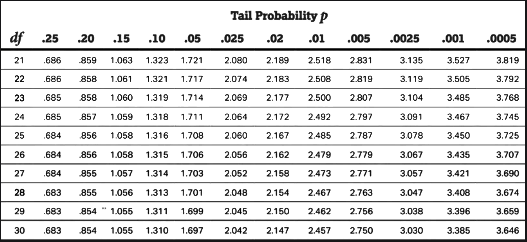
- For a one-tailed test, the p-value is 0.15.
- For a two-tailed test, double the tail probability (since the t-distribution is symmetric): p = 0.15 × 2 = 0.3.
Using a Calculator for T-Score and P-Value
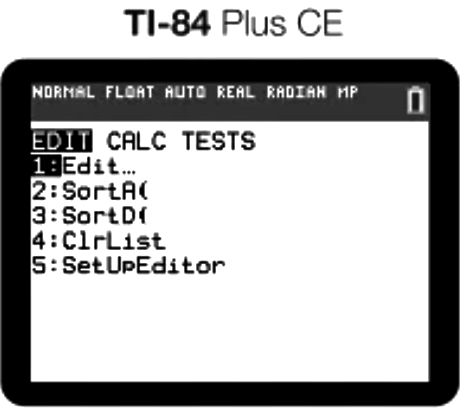
A graphing calculator, such as the Texas Instruments TI-84, simplifies the process of performing a one-sample t-test. To use the TI-84:
 Then, you will navigate over to tests and select option 2:
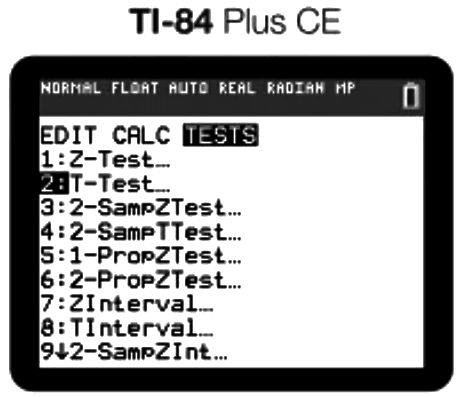
 You are then given two options: you can enter the given sample statistics or let the calculator use data points entered in Lists to calculate your necessary test statistic and p value. We will proceed with our example using Ricardo's.
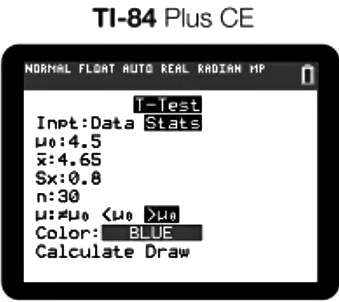
 Once you press calculate, it gives you your test statistic and p value. Both of these things are essential to list out in your written response to receive full credit on the AP exam. Also, it is important for a t-test for population mean to include your degrees of freedom, even though it is not listed in the computer output for the test.
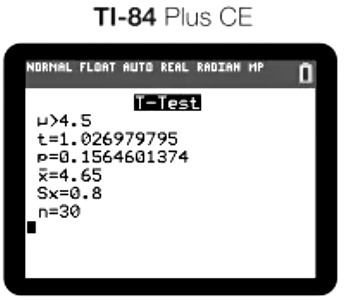

- Access the STAT menu.
- Navigate to TESTS and select option 2: T-Test.
- Choose to input sample statistics or use data from lists.
For Ricardo’s example, input the sample mean (4.65), hypothesized mean (4.5), standard deviation (0.8), and sample size (30). After selecting Calculate, the calculator provides the t-score and p-value. In your AP exam response, include the t-score, p-value, and degrees of freedom (not shown in the calculator output) for full credit.
Making Conclusions with the P-Value
The p-value indicates the probability of observing results as extreme as those obtained, assuming the null hypothesis is true. Compare the p-value to the significance level (typically α = 0.05):
- If p < α, reject the null hypothesis, indicating strong evidence for the alternative hypothesis.
- If p > α, fail to reject the null hypothesis, suggesting insufficient evidence for the alternative hypothesis.
Use these templates for conclusions:
- p < α: "Since p < α, we reject the null hypothesis. We have convincing evidence at the α level that [alternative hypothesis in context]."
- p > α: "Since p > α, we fail to reject the null hypothesis. We do not have convincing evidence at the α level that [alternative hypothesis in context]."
Note: Never state that you "accept" the null or alternative hypothesis.
Key Terms
- Degrees of Freedom (df): The number of independent values that can vary in a statistical calculation, calculated as sample size minus one. Essential for selecting appropriate statistical tests.
- Hypothesis Test: A method to make inferences about a population using sample data, involving null and alternative hypotheses to assess claims.
- P-Value: The probability of observing results as extreme as those obtained, assuming the null hypothesis is true. A smaller p-value suggests stronger evidence against the null.
- Sample Size: The number of observations in a sample, affecting the precision and power of statistical analyses.
- Significance Level (α): The threshold for rejecting the null hypothesis, representing the risk of a Type I error.
- Standard Error of the Mean (SEM): A measure of how much the sample mean varies from the population mean, calculated as the standard deviation divided by the square root of the sample size.
- Standard Deviation: A measure of data dispersion, showing how much individual data points deviate from the mean.
- T-Score: A statistic measuring the difference between the sample mean and population mean in standard error units, used in t-tests.
- T-Test: A statistical test to compare means or assess regression slopes, ideal for small samples with unknown population standard deviations.
- Texas Instruments TI-84: A graphing calculator used in AP Statistics for performing calculations and hypothesis tests efficiently.
|
12 videos|106 docs|12 tests
|
FAQs on Carrying Out a Test for a Population Mean Chapter Notes - AP Statistics - Grade 9
| 1. What is a T-Score and how is it calculated? |  |
| 2. How do I determine the P-Value from a T-Score? | |
| 3. Can I use a calculator to find the T-Score and P-Value? | |
| 4. What conclusions can I draw from the P-Value? | |
| 5. What is the significance of the significance level in hypothesis testing? | |


Semester Notes
,Exam
,Important questions
,MCQs
,Summary
,Free
,Carrying Out a Test for a Population Mean Chapter Notes | AP Statistics - Grade 9
,mock tests for examination
,Carrying Out a Test for a Population Mean Chapter Notes | AP Statistics - Grade 9
,Objective type Questions
,Extra Questions
,Carrying Out a Test for a Population Mean Chapter Notes | AP Statistics - Grade 9
,Sample Paper
,past year papers
,video lectures
,Previous Year Questions with Solutions
,shortcuts and tricks
,Viva Questions
,ppt
,study material
,practice quizzes
;


Chapter Notes: Carrying Out a Test for a Population Mean Free PDF Download
Importance of Chapter Notes: Carrying Out a Test for a Population Mean
Chapter Notes: Carrying Out a Test for a Population Mean
Chapter Notes: Carrying Out a Test for a Population Mean Grade 9 Questions
Study Chapter Notes: Carrying Out a Test for a Population Mean on the App
|
© EduRev
|
Education Revolution
|


|


