
|
 Statistical methods, Mode and Median 50 Flashcards |

Start
|

|
What is the mode of the following data set: 2, 2, 11, 9, 12? |

Card: 1 / 50 |
|
|
The mode is 2, as it appears most frequently in the data set.  |
Card: 2 / 50 |
|
|
The median value is determined by ___ the data set in ascending order and identifying the middle value. |
Card: 3 / 50 |
|
|
Ordering  |
Card: 4 / 50 |
|
|
True or False: The mode and median are always the same in a data set. |
Card: 5 / 50 |
|
|
False. The mode and median can differ significantly depending on the data distribution. 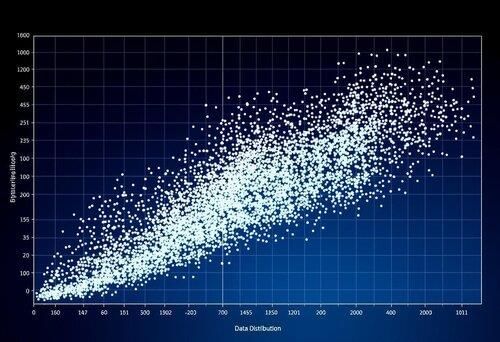 |
Card: 6 / 50 |
|
|
In a waffle diagram representing 20 squares, what percentage does 3 squares represent? |
Card: 7 / 50 |
|
|
15%, as each square represents 5%, so 3 squares equal 3 × 5% = 15%.  |
Card: 8 / 50 |
|
|
If the frequencies of hobbies are Swimming: 5, Video games: 2, Skate park: 1, Reading: 2, and Soccer: 10, calculate the proportion of Soccer. |
Card: 9 / 50 |
|
|
The proportion of Soccer is 10/20 = 1/2 = 50%.  |
Card: 10 / 50 |
|
|
Riddle: I am the most common score in a set, often repeated, but I am not always in the middle. What am I? |
Card: 11 / 50 |
|
|
I am the mode.  |
Card: 12 / 50 |
|
|
Fill in the blank: The median of the ordered set 2, 2, 9, 11, 12 is ___. |
Card: 13 / 50 |
|
|
9  |
Card: 14 / 50 |
|
|
What does a waffle diagram illustrate regarding proportions? |
Card: 15 / 50 |
|
|
A waffle diagramUnderstanding Waffle Diagrams
|
Card: 16 / 50 |
|
|
Based on the given frequencies of hobbies, what is the proportion of players who prefer soccer? |
Card: 17 / 50 |
|
|
The proportion of players who prefer soccer is 10/20, which simplifies to 1/2 or 50%.  |
Card: 18 / 50 |
|
|
Swimming contributes ___ to the overall frequency of hobbies. |
Card: 19 / 50 |
|
|
25% of the overall frequency of hobbies.  |
Card: 20 / 50 |
|
|
True or False: Waffle diagrams and bar charts both represent proportions in the same way. |
Card: 21 / 50 |
|
|
FalseUnderstanding Data Visualization: Waffle Diagrams vs. Bar Charts
|
Card: 22 / 50 |
|
|
What is the total frequency of activities mentioned in the example? |
Card: 23 / 50 |
|
|
The total frequency of activities is 20.  |
Card: 24 / 50 |
|
|
Riddle: I am a visual tool that breaks down parts of a whole into equal squares. What am I? |
Card: 25 / 50 |
|
|
 Unlock all Flashcards with EduRev Infinity Plan Starting from @ ₹99 only
|
|
|
|
A waffle diagram. 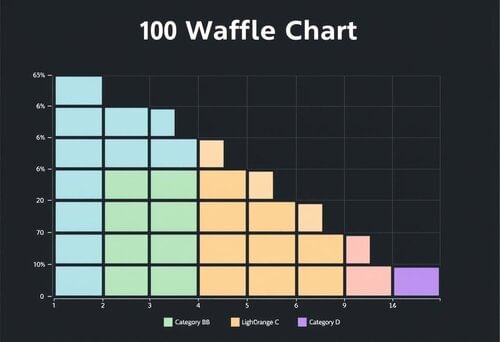 |
Card: 26 / 50 |
|
|
The proportion of swimming is ___ of the total activities. |
Card: 27 / 50 |
|
|
25%.  |
Card: 28 / 50 |
|
|
What is the frequency of playing video games as mentioned in the example? |
Card: 29 / 50 |
|
|
The frequency of playing video games is 2.  |
Card: 30 / 50 |
|
|
What does the term 'proportion' refer to in the context of the given hobbies? |
Card: 31 / 50 |
|
|
ProportionUnderstanding Proportion in Hobbies
|
Card: 32 / 50 |
|
|
What is the definition of the mode in a data set? |
Card: 33 / 50 |
|
|
The mode is the value that appears most frequently in a data set. 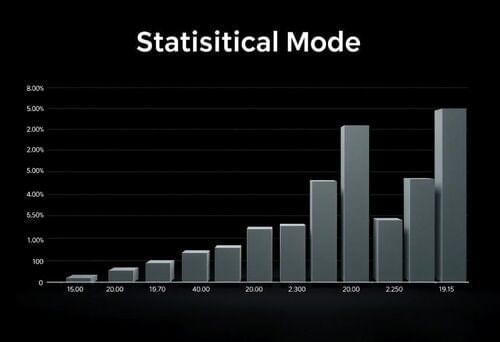 |
Card: 34 / 50 |
|
|
For the data set 2, 2, 11, 9, 12, what is the mode? |
Card: 35 / 50 |
|
|
The mode is 2, as it appears twice, more than any other number.  |
Card: 36 / 50 |
|
|
The median is defined as the ___ value in an ordered data set. |
Card: 37 / 50 |
|
|
Middle  |
Card: 38 / 50 |
|
|
In the ordered data set 2, 2, 9, 11, 12, what is the median? |
Card: 39 / 50 |
|
|
The median is 9, as it is the middle value with two scores below and two above. 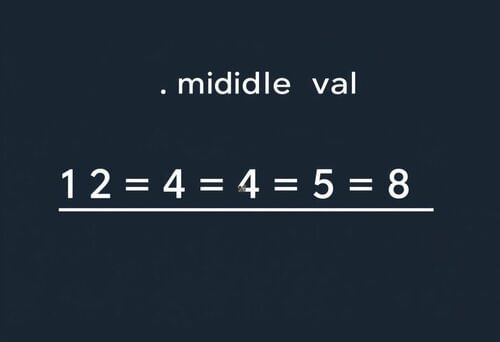 |
Card: 40 / 50 |
|
|
True or False: The mode and median always represent the same value in a data set. |
Card: 41 / 50 |
|
|
FalseUnderstanding Mode and Median
|
Card: 42 / 50 |
|
|
What does a proportion represent in data analysis? |
Card: 43 / 50 |
|
|
A proportionUnderstanding Proportions in Data Analysis
|
Card: 44 / 50 |
|
|
Fill in the blank: In a waffle diagram with 20 squares, each square represents ___ of the whole. |
Card: 45 / 50 |
|
|
5%  |
Card: 46 / 50 |
|
|
If there are 20 total votes with 10 for soccer, what is the proportion of votes for soccer? |
Card: 47 / 50 |
|
|
The proportion for soccer is 10/20, which simplifies to 1/2 or 50%.  |
Card: 48 / 50 |
|
|
Riddle: I am a number that is the center of a set, but not always the most popular. What am I? |
Card: 49 / 50 |
|
|
The median. 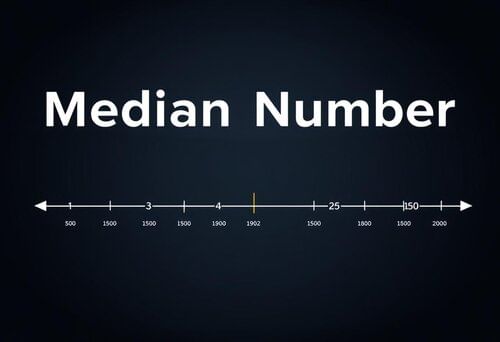 |
Card: 50 / 50 |
|
|
Completed! Keep practicing to master all of them. |

Restart
|


