


All Exams >
Mechanical Engineering >
GATE Mechanical (ME) Mock Test Series 2026 >
All Questions
All questions of Industrial Engineering for Mechanical Engineering Exam
The standard time of an operation while conducting a time study is: - a)Mean observed time + Allowances
- b)Normal time + Allowances
- c)Mean observed time × Rating factor + Allowances
- d)Normal time × Rating factor + Allowances
- e)
Correct answer is option 'C'. Can you explain this answer?
The standard time of an operation while conducting a time study is:
a)
Mean observed time + Allowances
b)
Normal time + Allowances
c)
Mean observed time × Rating factor + Allowances
d)
Normal time × Rating factor + Allowances
e)
|
|
Avinash Sharma answered |
Correct Answer :- c
Explanation : Thus, Standard time = Average Time × Rating factor + Other allowances.
Standard Time: It is the time, which is taken by a normal worker for a specific task or job, working under moderate conditions and includes other allowances such as fatigue, setting of tool and job, repairing of tool, checking of job etc.

The product structure of an assembly P is shown in the figure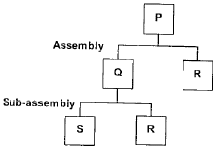 Estimated demand for end product P is as follows:
 Ignore lead times for assembly and sub-assembly. Production capacity (per week) for component R is the bottleneck operation. Starting with zero inventory, the smallest capacity that will ensure a feasible production plan up to week 6 is:
 - a)1000
- b)1200
- c)2200
- d)2400
Correct answer is option 'C'. Can you explain this answer?
The product structure of an assembly P is shown in the figure
Estimated demand for end product P is as follows:
Ignore lead times for assembly and sub-assembly. Production capacity (per week) for component R is the bottleneck operation. Starting with zero inventory, the smallest capacity that will ensure a feasible production plan up to week 6 is:
a)
1000
b)
1200
c)
2200
d)
2400

|
Alpesh Jain answered |
Please give reason
The maximum level of inventory of an item is 100 and it is 100 and it is achieved with infinite replenishment rate. The inventory becomes zero over one and half month due to consumption at a uniform rate. This cycle continues throughout the year. Ordering cost is Rs. 100 per order and inventory carrying cost is Rs. 10 per item per month. Annual cost (in Rs.) of the plan, neglecting material cost, is: - a)800
- b)2800
- c)4800
- d)6800
Correct answer is option 'D'. Can you explain this answer?
The maximum level of inventory of an item is 100 and it is 100 and it is achieved with infinite replenishment rate. The inventory becomes zero over one and half month due to consumption at a uniform rate. This cycle continues throughout the year. Ordering cost is Rs. 100 per order and inventory carrying cost is Rs. 10 per item per month. Annual cost (in Rs.) of the plan, neglecting material cost, is:
a)
800
b)
2800
c)
4800
d)
6800

|
Swara Dasgupta answered |
∴Number of cycles required per Year = 12 month/1.5 months = 8 cycles
Ordering cost = 8 * 100 = Rs. 800
Average inventory per cycle = 100/2 = 50
Inventory carrying cost = 50 * 12 * 10 = Rs. 6000
∴ Total cost = 800 + 6000 = 6800
Two machines of the same production rate are available for use. On machine 1, the fixed cost is Rs. 100 and the variable cost is Rs. 2 per piece produced. The corresponding numbers for the machine 2 are Rs. 200 and Re. 1 respectively. For certain strategic reasons both the machines are to be used concurrently. The sale price of the first 300 units is Rs. 3.50 per unit and subsequently it is only Rs. 3.00. The breakeven production rate for each machine is: - a)75
- b)100
- c)150
- d)600
Correct answer is option 'A'. Can you explain this answer?
Two machines of the same production rate are available for use. On machine 1, the fixed cost is Rs. 100 and the variable cost is Rs. 2 per piece produced. The corresponding numbers for the machine 2 are Rs. 200 and Re. 1 respectively. For certain strategic reasons both the machines are to be used concurrently. The sale price of the first 300 units is Rs. 3.50 per unit and subsequently it is only Rs. 3.00. The breakeven production rate for each machine is:
a)
75
b)
100
c)
150
d)
600

|
Bijoy Kapoor answered |

In ABC analysis, A items require: - a)No safety stock
- b)Low safety stock
- c)Moderate safety stock
- d)High safety stock
Correct answer is option 'B'. Can you explain this answer?
In ABC analysis, A items require:
a)
No safety stock
b)
Low safety stock
c)
Moderate safety stock
d)
High safety stock
|
|
Shruti Bose answered |
ABC analysis is a technique used in inventory management to classify items into three categories based on their importance. A items are the most important items, B items are moderately important, and C items are the least important. In this context, safety stock refers to the extra inventory that is kept on hand to guard against unexpected demand or supply chain disruptions.
The correct answer is option 'B', which means that A items require low safety stock. Here's why:
Importance of A items
A items are the most important items in inventory management. They typically have the highest value, the highest demand, or the highest impact on production. As a result, they require close monitoring and careful management to ensure that they are always available when needed.
Risk of stockouts
Because A items are so important, the risk of stockouts is high. If an A item is out of stock, it can cause a ripple effect throughout the supply chain, resulting in lost sales, production delays, and unhappy customers. Therefore, it's important to keep enough inventory on hand to meet demand.
Safety stock for A items
While A items require enough inventory to meet demand, they typically require lower levels of safety stock than B or C items. This is because A items are usually high-volume items with predictable demand patterns. As a result, it's easier to forecast demand for A items than for B or C items, which may have more erratic demand patterns.
In addition, because A items are so important, there is often more pressure to keep inventory levels low to minimize carrying costs. Therefore, it's important to strike a balance between having enough inventory to meet demand and keeping inventory levels low.
Conclusion
In summary, A items require low safety stock because they are high-volume items with predictable demand patterns. However, it's important to monitor A items closely and keep enough inventory on hand to guard against stockouts.
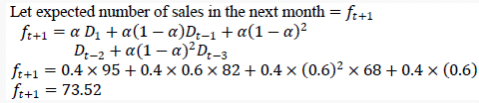
The sales of cycles in a shop in four consecutive months are given as 70, 68, 82, and 95. Exponentially smoothing average method with a smoothing factor of 0.4 is used in forecasting. The expected number of sales in the next month is: - a)59
- b)72
- c)86
- d)136
Correct answer is option 'B'. Can you explain this answer?
The sales of cycles in a shop in four consecutive months are given as 70, 68, 82, and 95. Exponentially smoothing average method with a smoothing factor of 0.4 is used in forecasting. The expected number of sales in the next month is:
a)
59
b)
72
c)
86
d)
136

|
Baishali Bajaj answered |
In time study, the rating factor is applied to determine - a)Standard time of a job
- b)Merit rating of the worker
- c)Fixation of incentive rate
- d)Normal time of a job
Correct answer is option 'B'. Can you explain this answer?
In time study, the rating factor is applied to determine
a)
Standard time of a job
b)
Merit rating of the worker
c)
Fixation of incentive rate
d)
Normal time of a job
|
|
Avik Ghosh answered |
In time study, the rating factor is applied to determine merit rating of the worker.
A company has an annual demand of 1000 units, ordering cost of Rs. 100/ order and carrying cost of Rs. 100/unit-year. If the stock-out costs are estimated to be nearly Rs. 400 each time the company runs out-of-stock, then safety stock justified by the carrying cost will be: - a)4
- b)20
- c)40
- d)100
Correct answer is option 'C'. Can you explain this answer?
A company has an annual demand of 1000 units, ordering cost of Rs. 100/ order and carrying cost of Rs. 100/unit-year. If the stock-out costs are estimated to be nearly Rs. 400 each time the company runs out-of-stock, then safety stock justified by the carrying cost will be:
a)
4
b)
20
c)
40
d)
100
|
|
Ananya Nair answered |
Given: D = 1000; Ordering cost, A = Rs. 100/order
Holding cost, H = Rs. 100/unit-year; Stock out cost, S = Rs. 400
Holding cost, H = Rs. 100/unit-year; Stock out cost, S = Rs. 400

Process I requires 20 units of fixed cost and 3 units of variable cost per piece, while Process II required 50 units of fixed cost and 1 unit of variable cost per piece. For a company producing 10 piece per day - a)Process I should be chosen
- b)Process II should be chosen
- c)Either of the two processes could be chosen
- d)A combination of process I and process II should be chosen
Correct answer is option 'A'. Can you explain this answer?
Process I requires 20 units of fixed cost and 3 units of variable cost per piece, while Process II required 50 units of fixed cost and 1 unit of variable cost per piece. For a company producing 10 piece per day
a)
Process I should be chosen
b)
Process II should be chosen
c)
Either of the two processes could be chosen
d)
A combination of process I and process II should be chosen
|
|
Kiran Basu answered |
For 10 pieces, it is economical to use process I.
A diagram showing the path followed by men and materials while performing a task is known as - a)String Diagram
- b)Flow Process Chart
- c)Travel Chart
- d)Flow Diagram
Correct answer is option 'B'. Can you explain this answer?
A diagram showing the path followed by men and materials while performing a task is known as
a)
String Diagram
b)
Flow Process Chart
c)
Travel Chart
d)
Flow Diagram
|
|
Sanskriti Basu answered |
A diagram showing the path followed by men and materials while performing a task is known as flow process chart.
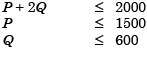
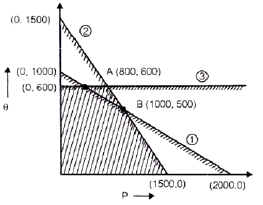
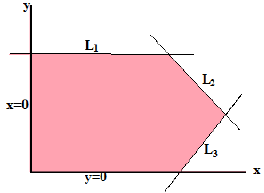
A company produces two types of toys: P and Q. Production time of Q is twice that of P and the company has a maximum of 2000 time units per day. The supply of raw material is just sufficient to produce 1500 toys (of any type) per day. Toy type Q requires an electric switch which is available @ 600 pieces per day only. The company makes a profit of Rs. 3 and Rs. 5 on type P and Q respectively. For maximization of profits, the daily production quantities of P and Q toys should respectively be: - a)100, 500
- b)500, 1000
- c)800, 600
- d)1000, 1000
Correct answer is option 'C'. Can you explain this answer?
A company produces two types of toys: P and Q. Production time of Q is twice that of P and the company has a maximum of 2000 time units per day. The supply of raw material is just sufficient to produce 1500 toys (of any type) per day. Toy type Q requires an electric switch which is available @ 600 pieces per day only. The company makes a profit of Rs. 3 and Rs. 5 on type P and Q respectively. For maximization of profits, the daily production quantities of P and Q toys should respectively be:
a)
100, 500
b)
500, 1000
c)
800, 600
d)
1000, 1000
|
|
Ishaan Mehta answered |
Clearly,
Simplex method of solving linear programming problem uses - a)All the points in the feasible region
- b)Only the corner points of the feasible region
- c)Intermediate points within the infeasible region
- d)Only the interior points in the feasible region
Correct answer is option 'B'. Can you explain this answer?
Simplex method of solving linear programming problem uses
a)
All the points in the feasible region
b)
Only the corner points of the feasible region
c)
Intermediate points within the infeasible region
d)
Only the interior points in the feasible region
|
|
Bijoy Kapoor answered |
Any linear programming problem involving two variables can be easily solved with the help of graphical method as it is easier to deal with two dimensional graph. All the feasible solutions in graphical method lies within the feasible area on the graph and we used to test the corner points of the feasible area for the optimal solution i.e. one of the corner points of the feasible area used to be the optimal solution. We used to test all the corner points by putting these value in objective function.
For a small scale industry, the fixed cost per month is Rs. 5000/-. The variable cost per product is Rs. 20/- and sales price is Rs. 30/- per piece. The break-even production per month will be: - a)300
- b)460
- c)500
- d)10000
Correct answer is option 'C'. Can you explain this answer?
For a small scale industry, the fixed cost per month is Rs. 5000/-. The variable cost per product is Rs. 20/- and sales price is Rs. 30/- per piece. The break-even production per month will be:
a)
300
b)
460
c)
500
d)
10000
|
|
Gopal Choudhury answered |
Break even production per month is 500.
Preliminary work sampling studies show that machine was idle 25% of the time based on a sample of 100 observations. The number of observations needed for a confidence level of 95% and an accuracy of ± 5% is: - a)400
- b)1200
- c)3600
- d)4800
Correct answer is option 'D'. Can you explain this answer?
Preliminary work sampling studies show that machine was idle 25% of the time based on a sample of 100 observations. The number of observations needed for a confidence level of 95% and an accuracy of ± 5% is:
a)
400
b)
1200
c)
3600
d)
4800
|
|
Shreya Choudhury answered |

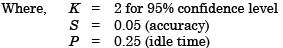
Number of observations needed for 95% confidence level and ± 5% accuracy is :
The manufacturing area of a plat is divided into four quadrants. Four machines have to be located, one in each quadrant. The total number of possible layouts is: - a)4
- b)8
- c)16
- d)24
Correct answer is option 'D'. Can you explain this answer?
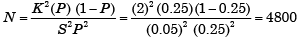
The manufacturing area of a plat is divided into four quadrants. Four machines have to be located, one in each quadrant. The total number of possible layouts is:
a)
4
b)
8
c)
16
d)
24
|
|
Gargi Joshi answered |
In quadrant I, we can locate any one of the four machines (i.e.) we can allocate quadrant I in 4 ways. Thereafter quadrant II in 3 ways, thereafter quadrant III in 2 ways. No further choice for quadrant IV.
∴ Total number of possible layouts
= 4 × 3 × 2 = 24
∴ Total number of possible layouts
= 4 × 3 × 2 = 24
When using a simple moving average to forecast demand, one would - a)Give equal weight to all demand data
- b)Assign more weight to the recent demand data
- c)Include new demand data in the average without discarding the earlier data
- d)Include new demand data in the average after discarding some of the earlier demand data
Correct answer is option 'D'. Can you explain this answer?
When using a simple moving average to forecast demand, one would
a)
Give equal weight to all demand data
b)
Assign more weight to the recent demand data
c)
Include new demand data in the average without discarding the earlier data
d)
Include new demand data in the average after discarding some of the earlier demand data
|
|
Bijoy Kapoor answered |
A moving average is a technique to get an overall idea of the trends in a data set; it is an average of any subset of numbers. The moving average is extremely useful for forecasting long-term trends. You can calculate it for any period of time. ... Moving averages are usually plotted and are best visualized.
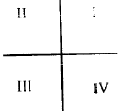
A soldering operation was work-sampled over two days (16 hours) during which an employee soldered 108 joints. Actual working time was 90% of the total time and the performance rating was estimated to be 120 percent. If the contract provides allowance of 20 percent of the total time available, the standard time for the operation would be: - a)8 min.
- b)8.9 min.
- c)10 min.
- d)12 min.
Correct answer is option 'D'. Can you explain this answer?
A soldering operation was work-sampled over two days (16 hours) during which an employee soldered 108 joints. Actual working time was 90% of the total time and the performance rating was estimated to be 120 percent. If the contract provides allowance of 20 percent of the total time available, the standard time for the operation would be:
a)
8 min.
b)
8.9 min.
c)
10 min.
d)
12 min.
|
|
Raghav Saini answered |
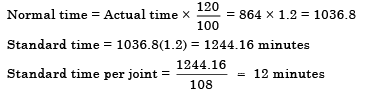
In a machine shop, pins of 15 mm diameter are produced at a rate of 1000 per month and the same is consumed at a rate of 500 per month. The production and consumption continue simultaneously till the maximum inventory is reached. Then inventory is allowed to reduce to zero due to consumption. The lot size of production is 1000. If backlog is not allowed, the maximum inventory level is: - a)400
- b)500
- c)600
- d)700
Correct answer is option 'B'. Can you explain this answer?
In a machine shop, pins of 15 mm diameter are produced at a rate of 1000 per month and the same is consumed at a rate of 500 per month. The production and consumption continue simultaneously till the maximum inventory is reached. Then inventory is allowed to reduce to zero due to consumption. The lot size of production is 1000. If backlog is not allowed, the maximum inventory level is:
a)
400
b)
500
c)
600
d)
700
|
|
Akshat Mehta answered |
MAXIMUM INVENTORY 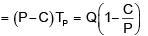
Consider the Linear Programme (LP)
Maximize 4x + 6y
subject to 3x + 2y ≤ 6
2x + 3y ≤ 6
x, y ≥ 0Q. The dual for the LP in Q 2 is: - a)Min 6u + 6v s ubje ct to 3u + 2v ≥ 4; 2u + 3v ≥ 6 u; and v ≥ 0
- b)Max 6u + 6u subje ct to 3u + 2v ≤ 4; 2u + 3v ≤ 6; and u, v ≥ 0
- c)Max 4u + 6v subje ct to 3u + 2v ≥ 6; 2u + 3v ≥ 6; and u, v ≥ 0
- d)Min 4u + 6u subje ct to 3u + 2v ≤ 6; 2u + 3v ≤ 6; and u, v ≥ 0
Correct answer is option 'A'. Can you explain this answer?
Consider the Linear Programme (LP)
Maximize 4x + 6y
subject to 3x + 2y ≤ 6
2x + 3y ≤ 6
x, y ≥ 0
Maximize 4x + 6y
subject to 3x + 2y ≤ 6
2x + 3y ≤ 6
x, y ≥ 0
Q.
The dual for the LP in Q 2 is:
a)
Min 6u + 6v s ubje ct to 3u + 2v ≥ 4; 2u + 3v ≥ 6 u; and v ≥ 0
b)
Max 6u + 6u subje ct to 3u + 2v ≤ 4; 2u + 3v ≤ 6; and u, v ≥ 0
c)
Max 4u + 6v subje ct to 3u + 2v ≥ 6; 2u + 3v ≥ 6; and u, v ≥ 0
d)
Min 4u + 6u subje ct to 3u + 2v ≤ 6; 2u + 3v ≤ 6; and u, v ≥ 0
|
|
Ayush Chawla answered |
Duplex method:
Step-I: Convert the problem to maximization form so Choice may be (b) or (c).
Step-II: Convert (≥) type con straints if any to (≤) type by multiplying such constraints by (–1) so our choice is (b).
Step-I: Convert the problem to maximization form so Choice may be (b) or (c).
Step-II: Convert (≥) type con straints if any to (≤) type by multiplying such constraints by (–1) so our choice is (b).
When solving the problem by Big-M method, if the objective functions row (evaluation row) shows optimality but one or more artificial variables are still in the basis, what type of solution does it show?- a)Optimal solution
- b)Pseudooptimal solution
- c)Degenerate solution
- d)Infeasible solution
Correct answer is option 'D'. Can you explain this answer?
When solving the problem by Big-M method, if the objective functions row (evaluation row) shows optimality but one or more artificial variables are still in the basis, what type of solution does it show?
a)
Optimal solution
b)
Pseudooptimal solution
c)
Degenerate solution
d)
Infeasible solution
|
|
Divyansh Goyal answered |
When solving the problem by Big-M method if the objective functions row (evaluation row) shows optimality but one or more artificial variables are still in the basis, this shows infeasible solution.
Consider the following objectives:1. To train the individual regarding motion economy.
2. To assist in research projects in the field of work study.
3. To help in the collection of Motion Time data. - a)1, 2 and 3
- b)1 and 2
- c)2 and 3
- d)1 and 3
Correct answer is option 'D'. Can you explain this answer?
Consider the following objectives:
1. To train the individual regarding motion economy.
2. To assist in research projects in the field of work study.
3. To help in the collection of Motion Time data.
2. To assist in research projects in the field of work study.
3. To help in the collection of Motion Time data.
a)
1, 2 and 3
b)
1 and 2
c)
2 and 3
d)
1 and 3
|
|
Kritika Joshi answered |
Objectives 1 and 3 are true for Micromotion study.
Fixed investments for manufacturing a product in a particular year is Rs. 80,000/- The estimated sales for this period is 2, 00,000/-. The variable cost per unit for this product is Rs. 4/-. If each unit is sold at Rs.20/-, then the break even point would be: - a)4,000
- b)5,000
- c)10,000
- d)20,000
Correct answer is option 'B'. Can you explain this answer?
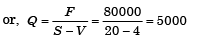
Fixed investments for manufacturing a product in a particular year is Rs. 80,000/- The estimated sales for this period is 2, 00,000/-. The variable cost per unit for this product is Rs. 4/-. If each unit is sold at Rs.20/-, then the break even point would be:
a)
4,000
b)
5,000
c)
10,000
d)
20,000
|
|
Hrishikesh Chakraborty answered |
For break even point,
Fixed cost (F) + Var iable cost (V) × Quantity (Q)
= Selling price (S) × Quantity (Q)
= Selling price (S) × Quantity (Q)
Which of the following factors are to be considered for production scheduling?1. Sales forecast
2. Component design
3. Route sheet
4. Time stand ardsSelect the correct answer using the codes given below: - a)1, 2 and 3
- b)1, 2 and 4
- c)1, 3 and 4
- d)2, 3 and 4
Correct answer is option 'D'. Can you explain this answer?
Which of the following factors are to be considered for production scheduling?
1. Sales forecast
2. Component design
3. Route sheet
4. Time stand ards
2. Component design
3. Route sheet
4. Time stand ards
Select the correct answer using the codes given below:
a)
1, 2 and 3
b)
1, 2 and 4
c)
1, 3 and 4
d)
2, 3 and 4

|
Diya Ahuja answered |
Factors to Consider for Production Scheduling
Production scheduling is an important aspect of manufacturing that helps in optimizing resources, reducing lead times, and improving productivity. The following factors are to be considered for production scheduling:
1. Sales Forecast
Sales forecast is an estimate of the future demand for a product or service. It is an important input for production scheduling as it helps in determining the quantity and timing of production. A company can use various methods to forecast sales, such as historical data analysis, market research, and trend analysis. By considering the sales forecast, a company can plan its production schedule to meet the demand and avoid overproduction or stockouts.
2. Component Design
Component design refers to the process of designing the parts or components that make up a product. The design of components can affect the production process, as some components may require specialized equipment or processes. By considering the component design, a company can plan its production schedule to ensure that the necessary resources and equipment are available to produce the components on time.
3. Route Sheet
A route sheet is a document that details the sequence of operations required to manufacture a product. It includes information such as the machines, tools, and materials required for each operation, as well as the time required to perform each operation. By considering the route sheet, a company can plan its production schedule to ensure that the necessary resources and equipment are available to perform each operation on time.
4. Time Standards
Time standards refer to the amount of time required to perform a specific operation or task. By considering time standards, a company can plan its production schedule to ensure that the necessary time is allocated for each operation. This can help in improving productivity, reducing lead times, and avoiding delays.
Conclusion
In conclusion, the factors to be considered for production scheduling include sales forecast, component design, route sheet, and time standards. By considering these factors, a company can plan its production schedule to meet the demand, optimize resources, and improve productivity.
In carrying out a work sampling study in a machine shop, it was found that a particular lathe was down for 20% of the time. What would be the 95% confidence interval of this estimate if 100 observations were made? - a)0.16, 0.24
- b)0.12, 0.28
- c)0.08, 0.32
- d)None of these
Correct answer is option 'B'. Can you explain this answer?
In carrying out a work sampling study in a machine shop, it was found that a particular lathe was down for 20% of the time. What would be the 95% confidence interval of this estimate if 100 observations were made?
a)
0.16, 0.24
b)
0.12, 0.28
c)
0.08, 0.32
d)
None of these

|
Divya Mehta answered |
Confidence Interval Calculation for Lathe Downtime
Given:
- Lathe downtime = 20%
- Number of observations = 100
- Confidence level = 95%
We can calculate the 95% confidence interval for the estimate of lathe downtime using the following formula:
CI = p ± Zα/2 * sqrt(p(1-p)/n)
Where:
- CI = confidence interval
- p = sample proportion (downtime percentage)
- Zα/2 = Z-score for the desired confidence level (1.96 for 95%)
- n = sample size
Substituting the given values:
CI = 0.2 ± 1.96 * sqrt(0.2(1-0.2)/100)
CI = 0.2 ± 0.04
CI = (0.16, 0.24)
Therefore, the 95% confidence interval for the estimate of lathe downtime is 0.16 to 0.24.
Option B, 0.12 to 0.28, is the closest answer choice to the calculated confidence interval.
Assertion (A): In distribution problem, unit cost of production as well as transportation cost is considered.Reason (R): The Vogel approximation method can reduce the number of iterations required to move from the initial assignment to the optimal solution. - a)Both A and R are individually true and R is the correct explanation of A
- b)Both A and R are individually true but R is not the correct explanation of A
- c)A is true but R is false
- d)A is false but R is true
Correct answer is option 'B'. Can you explain this answer?
Assertion (A): In distribution problem, unit cost of production as well as transportation cost is considered.
Reason (R): The Vogel approximation method can reduce the number of iterations required to move from the initial assignment to the optimal solution.
a)
Both A and R are individually true and R is the correct explanation of A
b)
Both A and R are individually true but R is not the correct explanation of A
c)
A is true but R is false
d)
A is false but R is true
|
|
Gayatri Dasgupta answered |
Both A and R are true and R is not correct explanation for A
Given T = Underlying trend, C = Cyclic variations within the trend, S = Seasonal variation within the trend and R = Residual, remaining or random variation, as per the time series analysis of sales forecasting, the demand will be a function of: - a)T and C
- b)R and S
- c)T, C and S
- d)T, C, S and R
Correct answer is option 'C'. Can you explain this answer?
Given T = Underlying trend, C = Cyclic variations within the trend, S = Seasonal variation within the trend and R = Residual, remaining or random variation, as per the time series analysis of sales forecasting, the demand will be a function of:
a)
T and C
b)
R and S
c)
T, C and S
d)
T, C, S and R
|
|
Rishika Choudhury answered |
Sale forecasting should not be influenced by the random variations in demand.
In a forecasting model, at the end of period 13, the forecasted value for period 14 is 75. Actual value in the periods 14 to 16 are constant at 100. If the assumed simple exponential smoothing parameter is 0.5, then the MSE at the end of period 16 is: - a)820.31
- b)273.44
- c)43.75
- d)14.58
Correct answer is option 'B'. Can you explain this answer?
In a forecasting model, at the end of period 13, the forecasted value for period 14 is 75. Actual value in the periods 14 to 16 are constant at 100. If the assumed simple exponential smoothing parameter is 0.5, then the MSE at the end of period 16 is:
a)
820.31
b)
273.44
c)
43.75
d)
14.58
|
|
Snehal Tiwari answered |
Given Information:
- Forecasted value for period 14 = 75
- Actual value in periods 14 to 16 = 100
- Simple exponential smoothing parameter (alpha) = 0.5
Mean Squared Error (MSE) Formula:
The MSE is calculated by taking the average of the squared differences between the forecasted values and the actual values over a given period. The formula for MSE is:
MSE = (1/n) * Σ(F_t - A_t)^2
Where:
- MSE = Mean Squared Error
- n = Number of periods
- F_t = Forecasted value at time t
- A_t = Actual value at time t
Calculation:
To calculate the MSE at the end of period 16, we need to consider the forecasted and actual values for periods 14 to 16.
Step 1: Calculate the forecasted values for periods 15 and 16 using the simple exponential smoothing formula:
F_15 = F_14 + α * (A_14 - F_14)
F_15 = 75 + 0.5 * (100 - 75) = 87.5
F_16 = F_15 + α * (A_15 - F_15)
F_16 = 87.5 + 0.5 * (100 - 87.5) = 93.75
Step 2: Calculate the MSE using the forecasted values and the actual values for periods 14 to 16:
MSE = (1/3) * [(F_14 - A_14)^2 + (F_15 - A_15)^2 + (F_16 - A_16)^2]
MSE = (1/3) * [(75 - 100)^2 + (87.5 - 100)^2 + (93.75 - 100)^2]
MSE = (1/3) * [(-25)^2 + (-12.5)^2 + (-6.25)^2]
MSE = (1/3) * [625 + 156.25 + 39.06]
MSE = (1/3) * 820.31
MSE ≈ 273.44
Therefore, the correct answer is option B) 273.44.
Manufacturing a product requires processing on four machines A, B, C, D in the order A – B – C – D. The capacities of four machines are A = 100, B = 110, C = 120 and D = 130 units per shift. If the expected output is 90% of the system capacity, then what is the expected output? - a)90 units
- b)99 units
- c)108 units
- d)117 units
Correct answer is option 'A'. Can you explain this answer?
Manufacturing a product requires processing on four machines A, B, C, D in the order A – B – C – D. The capacities of four machines are A = 100, B = 110, C = 120 and D = 130 units per shift. If the expected output is 90% of the system capacity, then what is the expected output?
a)
90 units
b)
99 units
c)
108 units
d)
117 units
|
|
Sparsh Chakraborty answered |
In the sequence of A – B – C – D only minimum output have to be calculated. Other machines will be on empty position.
∴ Output = η × 100= 0.9 × 100= 90 units
∴ Output = η × 100= 0.9 × 100= 90 units
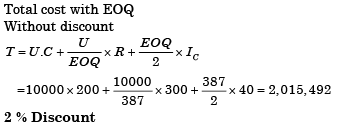
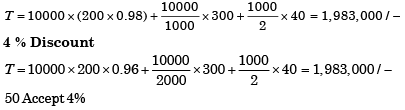
Annual demand for window frames is 10000. Each frame costs Rs. 200 and ordering cost is Rs. 300 per order. Inventory holding cost is Rs. 40 per frame per year. The supplier is willing to offer 2% discount if the order quantity is 1000 or more, and 4% if order quantity is 2000 or more. If the total cost is to be minimized, the retailer should- a)Order 200 frames every time
- b)Accept 2% discount
- c)Accept 4% discount
- d)Order Economic Order Quantity
Correct answer is option 'C'. Can you explain this answer?
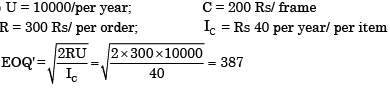
Annual demand for window frames is 10000. Each frame costs Rs. 200 and ordering cost is Rs. 300 per order. Inventory holding cost is Rs. 40 per frame per year. The supplier is willing to offer 2% discount if the order quantity is 1000 or more, and 4% if order quantity is 2000 or more. If the total cost is to be minimized, the retailer should
a)
Order 200 frames every time
b)
Accept 2% discount
c)
Accept 4% discount
d)
Order Economic Order Quantity
|
|
Amrita Chauhan answered |
The standard time of an operation has been calculated as 10 min. The worker was rated at 80%. If the relaxation and other allowances were 25%, then the observed time would be: - a)12.5 min
- b)10 min
- c)8 min
- d)6.5 min
Correct answer is option 'B'. Can you explain this answer?
The standard time of an operation has been calculated as 10 min. The worker was rated at 80%. If the relaxation and other allowances were 25%, then the observed time would be:
a)
12.5 min
b)
10 min
c)
8 min
d)
6.5 min
|
|
Kritika Joshi answered |
Observed time = (Standard time + Allowances) × Rating of worker
= 10 × (1 + 0.25) × 0.8 = 10
= 10 × (1 + 0.25) × 0.8 = 10
MTM is a work measurement technique by: - a)Stopwatch study
- b)Work sampling study
- c)Pre-determined motion time systems
- d)Past data comparison
Correct answer is option 'C'. Can you explain this answer?
MTM is a work measurement technique by:
a)
Stopwatch study
b)
Work sampling study
c)
Pre-determined motion time systems
d)
Past data comparison
|
|
Arya Menon answered |
MTM is a work measurement technique by Pre-determined motion time systems
Pre-determined motion time systems (PMTS) is a work measurement technique that is used to determine the time required to perform a specific task or operation. It is based on the principle that the time required to perform a task can be broken down into a series of basic motion elements, each with a predetermined time value.
What is MTM?
MTM stands for Methods-Time Measurement, which is a predetermined motion time system that is widely used in industries to establish standard times for performing various tasks. It is a systematic and scientific approach to measure the time required to perform a specific task, taking into account various factors such as the method, motion, and human capabilities.
How does MTM work?
MTM uses a set of predetermined time values called motion units to measure the time required for various basic motions involved in a task. These motion units are based on extensive studies and observations of human motions and have been standardized for different types of motions such as reach, grasp, move, and release.
Advantages of MTM:
- MTM provides a standardized and objective method for measuring the time required to perform a task, which helps in establishing fair and accurate time standards.
- It allows for the comparison of different methods and techniques used for performing a task, helping in identifying the most efficient and productive method.
- MTM helps in identifying and eliminating unnecessary or inefficient motions, leading to improved productivity and reduced fatigue.
- It provides a basis for determining labor costs and estimating production rates accurately.
- MTM can be used for job design and work simplification, enabling the development of more efficient and ergonomic workstations.
Conclusion
MTM is a valuable work measurement technique that allows for the accurate determination of time required to perform a task. It is based on the use of predetermined motion time systems, such as the MTM system, which provides standardized time values for different basic motions. By using MTM, organizations can establish fair and accurate time standards, identify and eliminate inefficiencies, and improve overall productivity and worker well-being.
If m is the number of constraints in a linear programming with two variables x and y and non-negativity constraints x ≥ 0, y ≥ 0; the feasible region in the graphical solution will be surrounded by how many lines? - a)m
- b)m + 1
- c)m + 2
- d)m + 4
Correct answer is option 'C'. Can you explain this answer?
If m is the number of constraints in a linear programming with two variables x and y and non-negativity constraints x ≥ 0, y ≥ 0; the feasible region in the graphical solution will be surrounded by how many lines?
a)
m
b)
m + 1
c)
m + 2
d)
m + 4
|
|
Anirudh Banerjee answered |
Constraints = 3 the feasible region is surrounded by more two lines x-axis and y-axis.
Which one of the following forecasting techniques is not suited for making forecasts for planning production schedules in the short range? - a)Moving average
- b)Exponential moving average
- c)Regression a nalysis
- d)Delphi
Correct answer is option 'D'. Can you explain this answer?
Which one of the following forecasting techniques is not suited for making forecasts for planning production schedules in the short range?
a)
Moving average
b)
Exponential moving average
c)
Regression a nalysis
d)
Delphi

|
Asha Nambiar answered |
Moving, average, Exponential moving average is used for short range.
Regression is used for short and medium range. Delphi is used for long range forecasting.
Regression is used for short and medium range. Delphi is used for long range forecasting.
Setup costs do not include - a)Labour cost of setting up machines
- b)Ordering cost of raw material
- c)Maintenance cost of the machines
- d)Cost of processing the work piece
Correct answer is option 'C'. Can you explain this answer?
Setup costs do not include
a)
Labour cost of setting up machines
b)
Ordering cost of raw material
c)
Maintenance cost of the machines
d)
Cost of processing the work piece
|
|
Neha Choudhury answered |
Setup cost is the costs incurred to configure a machine for a production run. This cost is considered a fixed cost of the associated batch, so its cost is spread over the number of units produced. Setup costs include the following:
1. Labor to position tools and materials next to the machine
2. Labor to configure the machine
3. Scrap cost of test units run on the machine
An item can be purchased for Rs 100. The ordering cost is Rs. 200 and the inventory carrying cost is 10% of the item cost annum. If the annual demand is 4000 units, then economic order quantity (in units) is: - a)50
- b)100
- c)200
- d)400
Correct answer is option 'D'. Can you explain this answer?
An item can be purchased for Rs 100. The ordering cost is Rs. 200 and the inventory carrying cost is 10% of the item cost annum. If the annual demand is 4000 units, then economic order quantity (in units) is:
a)
50
b)
100
c)
200
d)
400
|
|
Poulomi Patel answered |
Calculation of Economic Order Quantity (EOQ)
To calculate the Economic Order Quantity (EOQ), we need to consider the ordering cost and the carrying cost. The formula for EOQ is as follows:
EOQ = √((2DS) / H)
Where:
D = Annual demand
S = Ordering cost per order
H = Carrying cost per unit per annum
Given data:
Annual demand (D) = 4000 units
Ordering cost (S) = Rs. 200
Carrying cost (H) = 10% of item cost = 10% of Rs. 100 = Rs. 10
Substituting the values in the formula:
EOQ = √((2 * 4000 * 200) / 10)
Simplifying the equation:
EOQ = √(8000000 / 10)
EOQ = √800000
EOQ ≈ 894.43
Interpretation of the result:
Since the economic order quantity (EOQ) represents the optimal order quantity that minimizes the total cost of ordering and carrying inventory, we need to round up the result to the nearest whole number to determine the actual quantity to be ordered.
In this case, the EOQ is approximately 894.43 units. However, since we cannot order fractional units, we need to round up to the next whole number, which is 895 units. Therefore, the economic order quantity for this item is 895 units.
Conclusion:
The economic order quantity (EOQ) for the given scenario is 895 units. However, in the options provided, the closest whole number to the EOQ is 400 units, so the correct answer is option D) 400.
In PERT analysis a critical activity has - a)Maximum Float
- b)Zero Float
- c)Maximum Cost
- d)Minimum Cost
Correct answer is option 'B'. Can you explain this answer?
In PERT analysis a critical activity has
a)
Maximum Float
b)
Zero Float
c)
Maximum Cost
d)
Minimum Cost
|
|
Janhavi Choudhary answered |
PERT Analysis and Critical Activity
PERT (Program Evaluation and Review Technique) analysis is a project management tool used to evaluate and analyze the tasks involved in completing a project. It helps to identify the critical path and critical activities that are essential for the successful completion of the project. The critical path includes all the activities that have zero float or slack, which means any delay in these activities will delay the entire project.
Critical Activity and Zero Float
A critical activity is an activity that has zero float or slack in the PERT analysis. It means that the activity has no room for delay or flexibility, and any delay in the critical activity will delay the whole project. The critical path includes all the critical activities, and the duration of the project is determined by the critical path.
Importance of Identifying Critical Activities
Identifying critical activities is essential for project managers as they need to focus their attention on these activities to ensure they are completed on time. Any delay in the critical activities will delay the entire project, and project managers need to take appropriate actions to avoid delays.
Example of a Critical Activity
Suppose a construction project has a critical activity of laying the foundation of a building. If this activity is delayed due to any reason, the entire project will be delayed, and the project completion date will be pushed back. Therefore, project managers need to focus on completing this activity on time to ensure the project is completed within the given timeframe.
Conclusion
In PERT analysis, a critical activity is an activity that has zero float or slack. Identifying critical activities is essential for project managers as they need to focus their attention on completing these activities on time to ensure the project is completed within the given timeframe.
Assertion (A): A product layout is preferred when the flexibility in sequence of operations is required.Reason (R): Product layout reduces inventories as well as labour cost. - a)Both A and R are individually true and R is the correct explanation of A
- b)Both A and R are individually true but R is not the correct explanation of A
- c)A is true but R is false
- d)A is false but R is true
Correct answer is option 'D'. Can you explain this answer?
Assertion (A): A product layout is preferred when the flexibility in sequence of operations is required.
Reason (R): Product layout reduces inventories as well as labour cost.
a)
Both A and R are individually true and R is the correct explanation of A
b)
Both A and R are individually true but R is not the correct explanation of A
c)
A is true but R is false
d)
A is false but R is true
|
|
Rajat Khanna answered |
Explanation:
Product Layout and Flexibility:
- A product layout is designed to optimize the production process for a specific product or product line.
- It is characterized by a fixed sequence of operations, with each operation dedicated to a specific task related to the product being manufactured.
- This layout is not flexible and does not easily accommodate changes in the sequence of operations.
Reduced Inventories and Labor Cost:
- Product layout is known for its efficiency in reducing inventories and labor costs.
- By streamlining the production process and eliminating unnecessary movements or handling of materials, product layout can help in minimizing the need for excess inventory.
- Additionally, the specialized nature of tasks in a product layout reduces the labor requirements and can lead to cost savings in terms of labor expenses.
Relation to the Given Assertion:
- The assertion that a product layout is preferred when flexibility in the sequence of operations is required is not accurate.
- Product layout is actually chosen for its efficiency in handling a specific product or product line with a fixed sequence of operations.
- Therefore, the reason provided in the assertion does not correctly explain why a product layout is preferred.
Correct Answer:
- Option D is the correct answer, as the assertion is false (A is false) since product layout is not preferred for flexibility in sequence of operations, while the reason (R is true) stating that product layout reduces inventories and labor costs is accurate.
If the total investment is Rs. 5,00,000 for a target production, the income for the current year is Rs. 3,00,000 and total operating cost is Rs. 1,00,000; what is the economic yield? - a)10%
- b)30%
- c)20%
- d)40%
Correct answer is option 'D'. Can you explain this answer?
If the total investment is Rs. 5,00,000 for a target production, the income for the current year is Rs. 3,00,000 and total operating cost is Rs. 1,00,000; what is the economic yield?
a)
10%
b)
30%
c)
20%
d)
40%
|
|
Anjali Sengupta answered |
Calculation of Economic Yield:
1. Total Investment: Rs. 5,00,000
2. Income for the Current Year: Rs. 3,00,000
3. Total Operating Cost: Rs. 1,00,000
Formula for Economic Yield:
Economic Yield = (Income - Operating Cost) / Total Investment
Calculation:
Economic Yield = (3,00,000 - 1,00,000) / 5,00,000
Economic Yield = 2,00,000 / 5,00,000
Economic Yield = 0.4
Therefore, the Economic Yield is 40%, which is option 'D'.
Explanation:
An economic yield of 40% indicates that for every rupee invested, there is a return of 40 paise. This is a measure of the profitability and efficiency of the investment. In this case, the company has generated a significant return on investment, making it a financially viable decision. It is crucial for businesses to monitor and improve their economic yield to ensure sustainable growth and profitability.
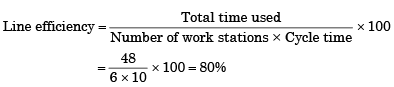
An operations consultant for an automatic car wash wishes to plan for enough capacity of stalls to handle 60 cars per hour. Each car will have a wash time of 3 minutes, but there is to be a 20% allowance for set-up time, delays and payment transactions. How many car wash stalls should be installed? - a)3
- b)4
- c)5
- d)6
Correct answer is option 'B'. Can you explain this answer?
An operations consultant for an automatic car wash wishes to plan for enough capacity of stalls to handle 60 cars per hour. Each car will have a wash time of 3 minutes, but there is to be a 20% allowance for set-up time, delays and payment transactions. How many car wash stalls should be installed?
a)
3
b)
4
c)
5
d)
6
|
|
Keerthana Joshi answered |
No. of wash stall = 4
Air cargo movements fall under: - a)Fixed path system
- b)Continuous system
- c)Intermittent system
- d)Variable path system
Correct answer is option 'A'. Can you explain this answer?
Air cargo movements fall under:
a)
Fixed path system
b)
Continuous system
c)
Intermittent system
d)
Variable path system
|
|
Kirti Bose answered |
Air cargo movements fall under fixed path system using conveyors.
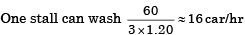
Consider the location of a warehouse to distribute books for the cities of Bombay, Bangalore and Calcutta. The estimated volume of distribution to Bombay, Bangalore and Calcutta are 55,000, 20,000 and 25,000 units respectively. Using some appropriate origin, the (x, y) co-ordinates of Bombay, Bangalore and Calcutta can be approximated as (10, 20), (20, 10) and (30, 30) respectively. The (x, y) co-ordinates or the optimal location would be: - a)(20, 20)
- b)(10, 20)
- c)(30, 20)
- d)(20, 30)
Correct answer is option 'A'. Can you explain this answer?
Consider the location of a warehouse to distribute books for the cities of Bombay, Bangalore and Calcutta. The estimated volume of distribution to Bombay, Bangalore and Calcutta are 55,000, 20,000 and 25,000 units respectively. Using some appropriate origin, the (x, y) co-ordinates of Bombay, Bangalore and Calcutta can be approximated as (10, 20), (20, 10) and (30, 30) respectively. The (x, y) co-ordinates or the optimal location would be:
a)
(20, 20)
b)
(10, 20)
c)
(30, 20)
d)
(20, 30)
|
|
Shreya Kulkarni answered |
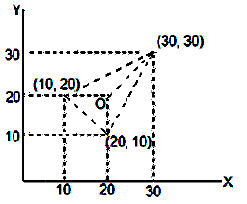
Consider the following PERT network:The optimistic time, most likely time and pessimistic time of all the activities are given in the table below: 
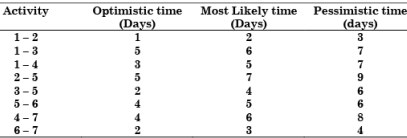 The critical path duration of the network (in days) is:
- a)11
- b)14
- c)17
- d)18
Correct answer is option 'D'. Can you explain this answer?
Consider the following PERT network:
The optimistic time, most likely time and pessimistic time of all the activities are given in the table below:
The critical path duration of the network (in days) is:
a)
11
b)
14
c)
17
d)
18

|
Jaydip Vadhel answered |
Option D is correct answer
The demand and forecast for February are 12000 and 10275, respectively. Using single exponential smoothening method (smoothening coefficient = 0.25), forecast for the month of March is: - a)431
- b)9587
- c)10706
- d)11000
Correct answer is option 'C'. Can you explain this answer?
The demand and forecast for February are 12000 and 10275, respectively. Using single exponential smoothening method (smoothening coefficient = 0.25), forecast for the month of March is:
a)
431
b)
9587
c)
10706
d)
11000
|
|
Sagarika Dey answered |
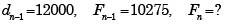
According to single exponential smoothing method

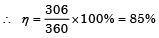
A company has four work centres A, B, C and D, with per day capacities of 450 units, 390 units, 360 units and 400 units respectively. The machines are laid down in order A, B, C, and D and product has to be operated on all these machines for getting converted into finished product. The actual output turns to be 306 units per day. What is the system efficiency? - a)68%
- b)78%
- c)80%
- d)85%
Correct answer is option 'D'. Can you explain this answer?
A company has four work centres A, B, C and D, with per day capacities of 450 units, 390 units, 360 units and 400 units respectively. The machines are laid down in order A, B, C, and D and product has to be operated on all these machines for getting converted into finished product. The actual output turns to be 306 units per day. What is the system efficiency?
a)
68%
b)
78%
c)
80%
d)
85%
|
|
Devansh Sengupta answered |
Maximum possible output 360 units per day Actual output is 306 per day
Production flow analysis (PFA) is a method of identifying part families that uses data from - a)Engineering drawings
- b)Production sc hedule
- c)Bill of materials
- d)Route sheets
Correct answer is option 'B,C'. Can you explain this answer?
Production flow analysis (PFA) is a method of identifying part families that uses data from
a)
Engineering drawings
b)
Production sc hedule
c)
Bill of materials
d)
Route sheets
|
|
Rajeev Menon answered |
Production flow analysis (PFA) is a method for identifying part families and associated machine groupings that uses the information contained on production route sheets rather than on part drawings. Workparts with identical or similar routings are classified into part families.
The procedure, for production flow analysis must begin by defining the scope of the study, which means deciding on the population of parts to be analyzed. Choice should be made if all the parts in the shop be included in the study, or a representative sample be selected for analysis.
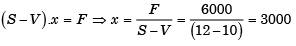
In the production of a product the fixed costs are Rs. 6,000/- and the variable cost is Rs. 10/- per product. If the sale price of the product is Rs. 12/-, the break even volume of products to be made will be: - a)2000
- b)3000
- c)4000
- d)6000
Correct answer is option 'B'. Can you explain this answer?
In the production of a product the fixed costs are Rs. 6,000/- and the variable cost is Rs. 10/- per product. If the sale price of the product is Rs. 12/-, the break even volume of products to be made will be:
a)
2000
b)
3000
c)
4000
d)
6000
|
|
Sparsh Chakraborty answered |
A control chart is established with limits of ± 2 standard errors for use in monitoring samples of size n = 20. Assume the process to be in control. What is the likelihood of a sample mean falling outside the control limits? - a)97.7%
- b)95.5%
- c)4.5%
- d)2.3%
Correct answer is option 'C'. Can you explain this answer?
A control chart is established with limits of ± 2 standard errors for use in monitoring samples of size n = 20. Assume the process to be in control. What is the likelihood of a sample mean falling outside the control limits?
a)
97.7%
b)
95.5%
c)
4.5%
d)
2.3%

|
Prashanth Mehra answered |
To find the likelihood of a sample mean falling outside the control limits, we need to consider the properties of a control chart and the characteristics of the normal distribution.
**Control Chart and Control Limits:**
A control chart is a statistical tool used to monitor and control processes. It consists of a central line (often the process mean) and upper and lower control limits. These control limits are typically set at a certain number of standard errors away from the central line.
In this case, the control chart is established with limits of 2 standard errors. This means that the upper control limit (UCL) is set at 2 standard errors above the process mean, and the lower control limit (LCL) is set at 2 standard errors below the process mean.
**Sampling Distribution of the Sample Mean:**
When we take multiple samples from a population, the sample means will have a distribution known as the sampling distribution of the sample mean. This distribution follows the properties of the normal distribution.
One important characteristic of the normal distribution is that approximately 95% of the data falls within 2 standard deviations (standard errors) of the mean. This means that if the process is in control, we would expect about 95% of the sample means to fall within the control limits.
**Likelihood of a Sample Mean Falling Outside the Control Limits:**
Since the control limits are set at 2 standard errors away from the process mean, and approximately 95% of the sample means are expected to fall within these limits, the remaining 5% would fall outside the control limits.
Therefore, the likelihood of a sample mean falling outside the control limits is 5%. This corresponds to option C, which states that the likelihood is 4.5%.
Assertion (A): Planning and scheduling of job order manufacturing differ from planning and scheduling of mass production manufacturing.Reason (R): In mass production manufacturing, a large variety of products are manufactured in large quantity. - a)Both A and R are individually true and R is the correct explanation of A
- b)Both A and R are individually true but R is not the correct explanation of A
- c)A is true but R is false
- d)A is false but R is true
Correct answer is option 'C'. Can you explain this answer?
Assertion (A): Planning and scheduling of job order manufacturing differ from planning and scheduling of mass production manufacturing.
Reason (R): In mass production manufacturing, a large variety of products are manufactured in large quantity.
a)
Both A and R are individually true and R is the correct explanation of A
b)
Both A and R are individually true but R is not the correct explanation of A
c)
A is true but R is false
d)
A is false but R is true

|
Piyush Kale answered |
In Mass production, single product is produced in large quantity not variety of product in large quantity
While solving a linear programming problem by simplex method, if all ratios of the right-hand side (bi) to the coefficient, in the key row (aij) become negative, then the problem has which of the following types of solution? - a)An unbound solution
- b)Multiple solutions
- c)A unique solution
- d)No solution
Correct answer is option 'A'. Can you explain this answer?
While solving a linear programming problem by simplex method, if all ratios of the right-hand side (bi) to the coefficient, in the key row (aij) become negative, then the problem has which of the following types of solution?
a)
An unbound solution
b)
Multiple solutions
c)
A unique solution
d)
No solution
|
|
Suyash Patel answered |
Explanation:
Simplex Method:
The simplex method is an iterative procedure used to solve linear programming problems. It starts with an initial feasible solution and then iterates to improve the objective function value until an optimal solution is reached.
Ratios of the Right-Hand Side to Coefficients:
In the simplex method, the ratios of the right-hand side (bi) to the coefficients (aij) in the key row are calculated. These ratios are used to determine the pivot column and pivot row in each iteration of the simplex method.
Types of Solutions:
There are four types of solutions that can be obtained while solving a linear programming problem by the simplex method:
a) Unbounded solution: If all the ratios of the right-hand side to the coefficients in the key row become negative, it indicates that the objective function can be improved indefinitely. This implies that the feasible region is unbounded, and there is no optimal solution to the problem.
b) Multiple solutions: If there are multiple optimal solutions to the linear programming problem, it means that there are different combinations of decision variables that can yield the same optimal objective function value.
c) Unique solution: If there is only one combination of decision variables that yields the optimal objective function value, then the problem has a unique solution.
d) No solution: If the feasible region is empty or there are no feasible solutions that satisfy all the constraints, then the problem has no solution.
Answer Explanation:
In the given problem, if all the ratios of the right-hand side to the coefficients in the key row become negative, it indicates that the objective function can be improved indefinitely. This implies that the feasible region is unbounded, and there is no optimal solution to the problem. Therefore, the correct answer is option 'A' - An unbounded solution.
Chapter doubts & questions for Industrial Engineering - GATE Mechanical (ME) Mock Test Series 2026 2025 is part of Mechanical Engineering exam preparation. The chapters have been prepared according to the Mechanical Engineering exam syllabus. The Chapter doubts & questions, notes, tests & MCQs are made for Mechanical Engineering 2025 Exam. Find important definitions, questions, notes, meanings, examples, exercises, MCQs and online tests here.
Chapter doubts & questions of Industrial Engineering - GATE Mechanical (ME) Mock Test Series 2026 in English & Hindi are available as part of Mechanical Engineering exam.
Download more important topics, notes, lectures and mock test series for Mechanical Engineering Exam by signing up for free.
GATE Mechanical (ME) Mock Test Series 2026
30 docs|220 tests
|
|
© EduRev
|
Education Revolution
|


|


Signup to see your scores
go up within 7 days!
Access 1000+ FREE Docs, Videos and Tests
Takes less than 10 seconds to signup