


All Exams >
Mechanical Engineering >
General Aptitude for GATE >
All Questions
All questions of Data graphs for Mechanical Engineering Exam
Practice Quiz or MCQ (Multiple Choice Questions) with solutions are available for Practice, which would help you prepare for "Bar Graphs" under LR and DI. You can practice these practice quizzes as per your speed and improvise the topic. The same topic is covered under various competitive examinations like - CAT, GMAT, Bank PO, SSC and other competitive examinations.Q. What is the ratio of the total sales of branch B2 for both years to the total sales of branch B4 for both years?
- a)2:3
- b)
3:5 - c)4:5
- d)7:9
Correct answer is option 'D'. Can you explain this answer?
Practice Quiz or MCQ (Multiple Choice Questions) with solutions are available for Practice, which would help you prepare for "Bar Graphs" under LR and DI. You can practice these practice quizzes as per your speed and improvise the topic. The same topic is covered under various competitive examinations like - CAT, GMAT, Bank PO, SSC and other competitive examinations.
Q.
What is the ratio of the total sales of branch B2 for both years to the total sales of branch B4 for both years?
a)
2:3
b)
3:5
c)
4:5
d)
7:9
|
|
Nilesh Kumar answered |
Required ratio = 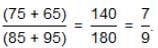

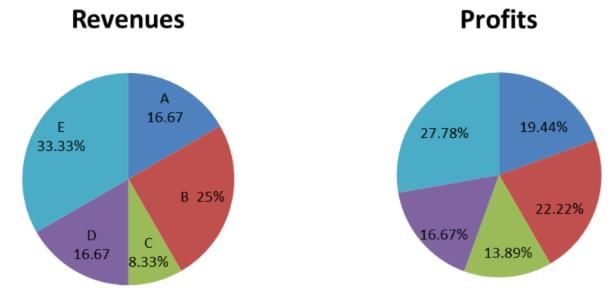
Total revenues are Rs. 1800 crores. Overall profit margin is 10%. The division with the largest revenue has the least profit margin but not the least profits. The division with the profit margin higher than all others generates the least profit. Exactly one division has the same profit margin as the overall Company. Company D generates more profits than Company E.
 Q. How much profit did Company A make?
- a)Rs. 60 crores
- b)Rs. 50 crores
- c)Rs. 25 crores
- d)Rs. 30 crores
Correct answer is option 'D'. Can you explain this answer?
Total revenues are Rs. 1800 crores. Overall profit margin is 10%. The division with the largest revenue has the least profit margin but not the least profits. The division with the profit margin higher than all others generates the least profit. Exactly one division has the same profit margin as the overall Company. Company D generates more profits than Company E.
Q. How much profit did Company A make?
a)
Rs. 60 crores
b)
Rs. 50 crores
c)
Rs. 25 crores
d)
Rs. 30 crores

|
EduRev CAT answered |
- Total revenues are Rs. 1800 crores.
- Overall profit margin is 10%
- Overall profit is Rs. 180 crores.
- Exactly one division has the same profit margin as the overall Company. So, for this division, share of revenues should be equal to share of profits. Or, one of Company A or D has a profit margin of 10%
- Let us also compute absolute profit numbers the 5 numbers are Rs. 35 crores, Rs. 40 crores, Rs. 25 crores, Rs. 30 crores and Rs. 50 crores
- The division with the largest revenue has the least profit margin but not the least profits: So, E has the least profit margin but not the least profits. Company D generates more profits than Company E, so Company E does not generate the least profit either
- So, Company E should generate profits of Rs. 35 crores or Rs. 40 crores.
- Now, this is the critical statement - "The division with the profit margin higher than all others generates the least profit? Company C has the least revenue, and by a distance. So, it is possible that division C should have the highest profit margin. The lowest profit margin for division C should be 16.67%, Now, if the Rs. 25 crore profit were for any other division, the profit margin of that division would be less than 16.67%. This tells us that the Rs. 25 crore profit is made by division C at a profit margin of 16.67%.
- So this is where we stand now
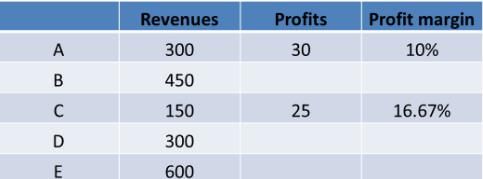
- The three missing profit numbers are Rs. 50 crores, Rs. 40 crores and Rs. 35 crores
- Company E did not generate profit of Rs. 50 crores. So, the Rs. 50 crore profit number should have been seen by either B or D. If it had been D, then D would also have had a profit margin of 16,67%. But this is not possible as the question says - "The division with the profit margin higher than all others generates the least profit. The above statement tells us that no company apart from C had a profit margin of 16.67% or more. So, Company B should have seen a profit of Rs. 50 crores.
- Company D generates more profit than E so E should have seen a profit of 35 crores and D a profit of Rs 40 crores
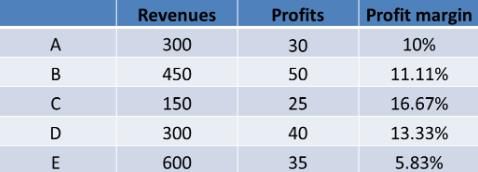
- Therefore, the Profit that Company A made is equal to 30 crores

The following line graph gives the ratio of the amounts of imports by a company to the amount of exports from that company over the period from 1995 to 2001. What was the percentage increase in imports from 1997 to 1998 ?
- a)72
- b)56
- c)28
- d)Data inadequate
Correct answer is option 'D'. Can you explain this answer?
The following line graph gives the ratio of the amounts of imports by a company to the amount of exports from that company over the period from 1995 to 2001.
What was the percentage increase in imports from 1997 to 1998 ?
a)
72
b)
56
c)
28
d)
Data inadequate

|
Master Training Institute answered |
The graph gives only the ratio of imports to exports for different years. To find the percentage increase in imports from 1997 to 1998, we require more details such as the value of imports or exports during these years.
Hence, the data is inadequate to answer this question.
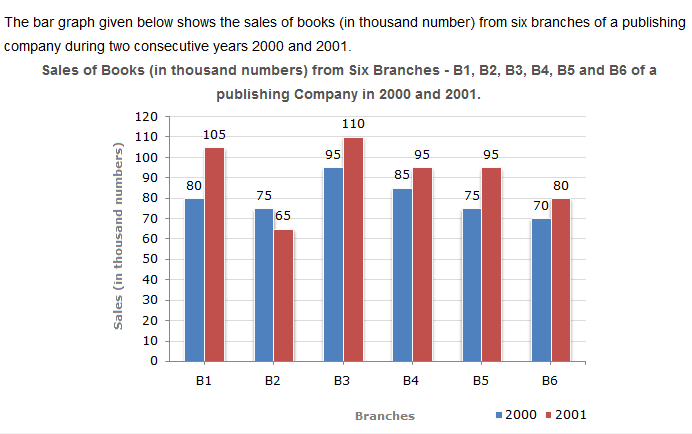
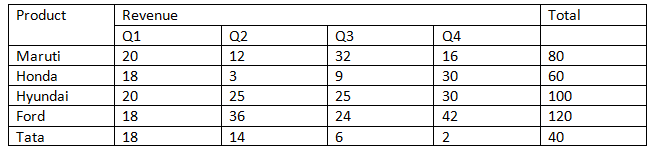
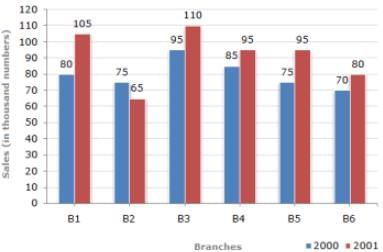
The bar graph given below shows the sales of books (in thousand number) from six branches of a publishing company during two consecutive years 2000 and 2001.Sales of Books (in thousand numbers) from Six Branches - B1, B2, B3, B4, B5 and B6 of a publishing
Company in 2000 and 2001.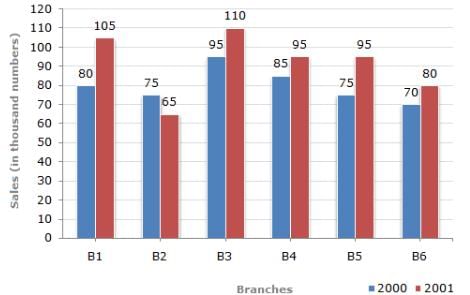
Q. Total sales of branches B1, B3 and B5 together for both the years (in thousand numbers) is?- a)250
- b)310
- c)435
- d)560
Correct answer is option 'D'. Can you explain this answer?
The bar graph given below shows the sales of books (in thousand number) from six branches of a publishing company during two consecutive years 2000 and 2001.
Sales of Books (in thousand numbers) from Six Branches - B1, B2, B3, B4, B5 and B6 of a publishing
Company in 2000 and 2001.
Company in 2000 and 2001.
Q. Total sales of branches B1, B3 and B5 together for both the years (in thousand numbers) is?
a)
250
b)
310
c)
435
d)
560

|
Pallavi Shah answered |
Total sales of branches B1, B3 and B5 for both the years (in thousand numbers)
= (80 + 105) + (95 + 110) + (75 + 95)
= 560.
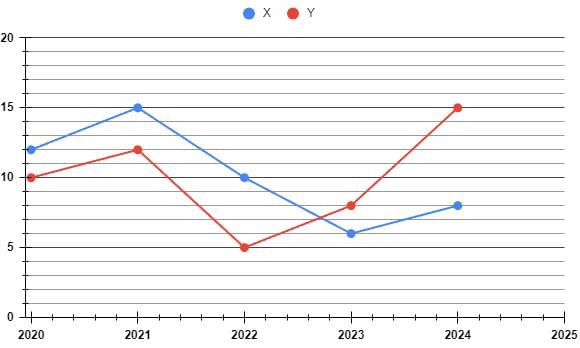
Directions: The following line graph shows the data of rate of interests provided by company X and Y in the following 5 years, 2020, 2021, 2022, 2023,and 2024. (all the interest rates are simple interest rate)
 A person invests an amount of Rs. 50000 in company Y in 2023 for 1 year. After one year, from the total amount received, he bought a Television worth of Rs. 20000 and invested the remaining amount in company X for one year. Find the interest received by him from the investment.
- a)Rs. 2520
- b)Rs. 2620
- c)Rs. 2800
- d)Rs. 2820
Correct answer is option 'C'. Can you explain this answer?
Directions: The following line graph shows the data of rate of interests provided by company X and Y in the following 5 years, 2020, 2021, 2022, 2023,and 2024. (all the interest rates are simple interest rate)
A person invests an amount of Rs. 50000 in company Y in 2023 for 1 year. After one year, from the total amount received, he bought a Television worth of Rs. 20000 and invested the remaining amount in company X for one year. Find the interest received by him from the investment.
a)
Rs. 2520
b)
Rs. 2620
c)
Rs. 2800
d)
Rs. 2820

|
Aim It Academy answered |
Given:
A person invests an amount of Rs. 50000 in company Y in 2023 for 1 year
He bought a Television worth of Rs. 20000 in the next year with the amount received
He invested the remaining amount in company X for one year
Concept Used:
Simple interest (SI) = (P × R × T)/100
Where, P = principal amount, R = rate of interest, and T = time of investment
Calculation:
Amount received after 1 year from Y = 50000 + (50000 × 8)/100 = Rs. 54000
Remaining amount after buying television = 54000 - 20000 = Rs. 34000
Interest received on Rs. 34000 in the next year from X = (34000 × 8)/100 = Rs. 2720
∴ The correct answer is option 3
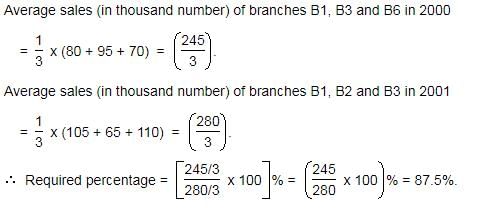
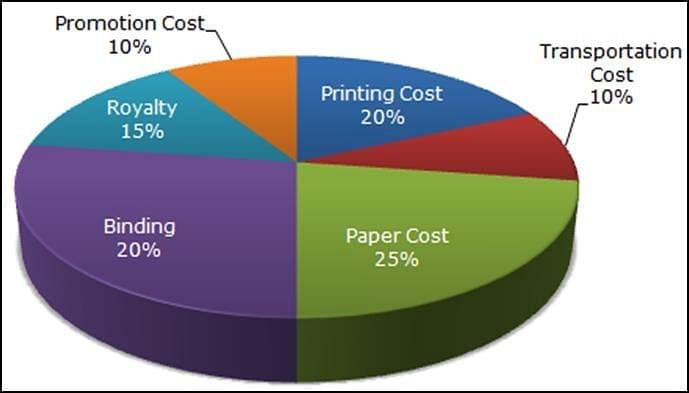
The following pie-chart shows the percentage distribution of the expenditure incurred in publishing a book. Study the pie-chart and the answer the questions based on it.Various Expenditures (in percentage) Incurred in Publishing a Book
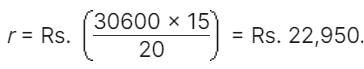
 Q. If for a certain quantity of books, the publisher has to pay Rs. 30,600 as printing cost, then what will be amount of royalty to be paid for these books?
- a)Rs. 22,950
- b)Rs. 21,200
- c)Rs. 19,450
- d)Rs. 26,150
Correct answer is option 'A'. Can you explain this answer?
The following pie-chart shows the percentage distribution of the expenditure incurred in publishing a book. Study the pie-chart and the answer the questions based on it.
Various Expenditures (in percentage) Incurred in Publishing a Book
Q. If for a certain quantity of books, the publisher has to pay Rs. 30,600 as printing cost, then what will be amount of royalty to be paid for these books?
a)
Rs. 22,950
b)
Rs. 21,200
c)
Rs. 19,450
d)
Rs. 26,150

|
Upsc Rank Holders answered |
Let the amount of Royalty to be paid for these books be Rs. r.
Then, 20 : 15 = 30600 : r
Instructions: The pie chart shown below gives the percentage distribution of car sales (in
numbers) between five companies – Maruti, Honda, Hyundai, Ford and Tata during the year 2014 – 2015. The total number of cars sold by the five companies together in 2014-2015 is four hundred thousand.
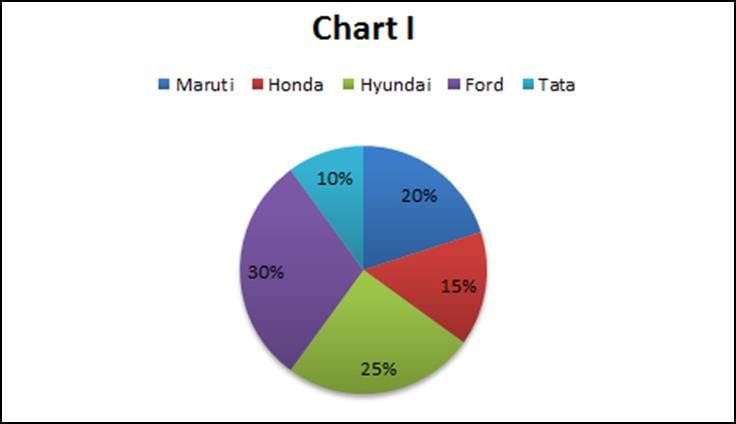
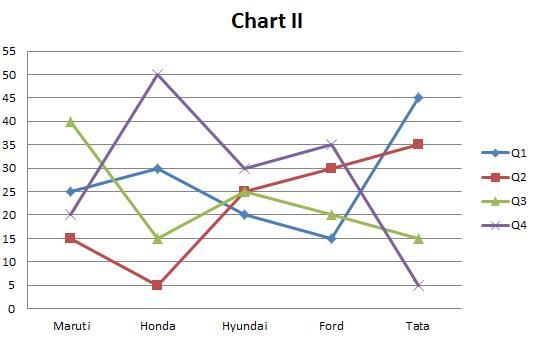
The line graph shown below gives the percentage distribution of the number of cars sold by each of the five companies in the four different Quarters of the year.
 Q. Which company sold the highest number of cars in the second quarter?
- a)Ford
- b)Maruti
- c)Honda
- d)Hyundai
Correct answer is option 'A'. Can you explain this answer?
Instructions: The pie chart shown below gives the percentage distribution of car sales (in
numbers) between five companies – Maruti, Honda, Hyundai, Ford and Tata during the year 2014 – 2015. The total number of cars sold by the five companies together in 2014-2015 is four hundred thousand.
The line graph shown below gives the percentage distribution of the number of cars sold by each of the five companies in the four different Quarters of the year.
Q. Which company sold the highest number of cars in the second quarter?
a)
Ford
b)
Maruti
c)
Honda
d)
Hyundai

|
Aspire Academy answered |
The data given in the pie chart and the line chart can be tabulated into the following table (Data is in 000’s):
From the table, we can see that Ford sold the highest number of cars in the second quarter.
From the table, we can see that Ford sold the highest number of cars in the second quarter.
Instructions:
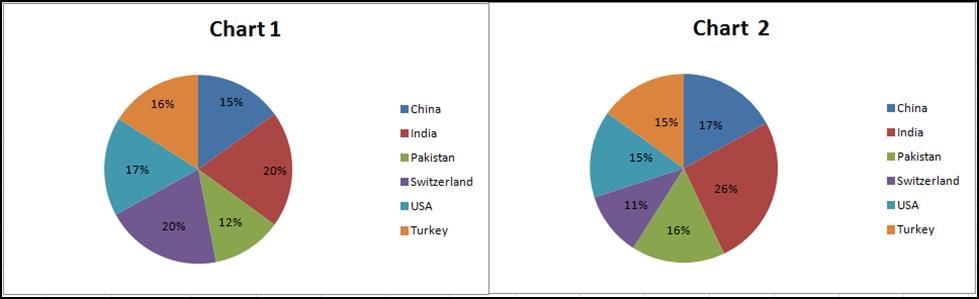
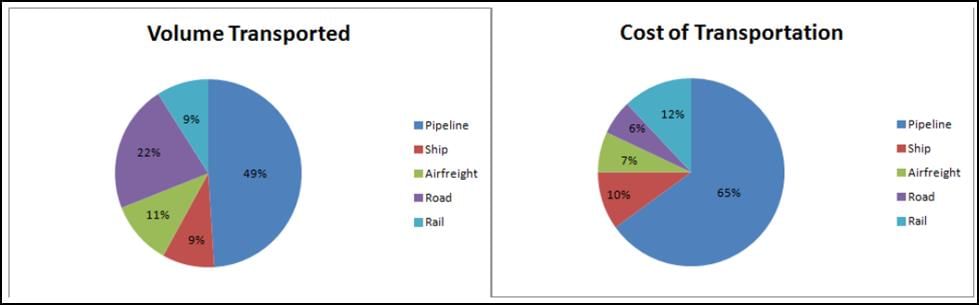
For the following three questions: Answer the questions based on the pie charts given below. Chart 1 shows the distribution of 12 million tonnes of crude oil transported through different modes over a specific period of time. Chart 2 shows the distribution of the cost of transporting this crude oil. The total cost was Rs. 30 million.
 Q. The cost in rupees per tonne of oil moved by rail and road happens to be roughly
- a)Rs. 3
- b)Rs. 1.5
- c)Rs. 4.5
- d)Rs. 8
Correct answer is option 'B'. Can you explain this answer?
Instructions:
For the following three questions: Answer the questions based on the pie charts given below. Chart 1 shows the distribution of 12 million tonnes of crude oil transported through different modes over a specific period of time. Chart 2 shows the distribution of the cost of transporting this crude oil. The total cost was Rs. 30 million.
Q. The cost in rupees per tonne of oil moved by rail and road happens to be roughly
a)
Rs. 3
b)
Rs. 1.5
c)
Rs. 4.5
d)
Rs. 8

|
S.S Career Academy answered |
Total tonnes of transportation by both rail and road is about 31*12/100 = 3.72 million tonnes and total cost incured 18*30/100 = 5.4 .
Hence required value is 5.4/3.72 which is about 1.5.
Hence option B .
Total revenues are Rs. 1800 crores. Overall profit margin is 10%. The division with the largest revenue has the least profit margin but not the least profits. The division with the profit margin higher than all others generates the least profit. Exactly one division has the same profit margin as the overall Company. Company D generates more profits than Company E.
 Q. What was the profit margin for company B?
- a)8.33%
- b)12.5%
- c)11.11%
- d)12.33%
Correct answer is option 'C'. Can you explain this answer?
Total revenues are Rs. 1800 crores. Overall profit margin is 10%. The division with the largest revenue has the least profit margin but not the least profits. The division with the profit margin higher than all others generates the least profit. Exactly one division has the same profit margin as the overall Company. Company D generates more profits than Company E.
Q. What was the profit margin for company B?
a)
8.33%
b)
12.5%
c)
11.11%
d)
12.33%

|
Elite Coaching Classes answered |
- Identify the emissions data:
• 2005: 500 million metric tons
• 2009: 800 million metric tons
• Total growth: 800 – 500 = 300 (60% increase over 4 years). - Calculate year‑on‑year growth rates:
• 2005–2006: (600 – 500) / 500 ≈ 20%
• 2006–2007: (650 – 600) / 600 ≈ 8.33%
• 2007–2008: (700 – 650) / 650 ≈ 7.69%
• 2008–2009: (800 – 700) / 700 ≈ 14.29% - Compute the arithmetic mean of annual growth rates:
(20% + 8.33% + 7.69% + 14.29%) / 4 ≈ 50.31% / 4 ≈ 12.5775%
Rounded to two decimal places: 12.57%.
Directions: The following line graph shows the data of rate of interests provided by company X and Y in the following 5 years, 2020, 2021, 2022, 2023,and 2024. (all the interest rates are simple interest rate)
 In 2023, a part of Rs. 45,000 is invested in company X and the rest was invested in company Y for 1 year. If the total interest received is Rs. 3100, then what was the amount invested in company X?
- a)Rs. 20000
- b)Rs. 25000
- c)Rs. 15000
- d)Rs. 30000
Correct answer is option 'B'. Can you explain this answer?
Directions: The following line graph shows the data of rate of interests provided by company X and Y in the following 5 years, 2020, 2021, 2022, 2023,and 2024. (all the interest rates are simple interest rate)
In 2023, a part of Rs. 45,000 is invested in company X and the rest was invested in company Y for 1 year. If the total interest received is Rs. 3100, then what was the amount invested in company X?
a)
Rs. 20000
b)
Rs. 25000
c)
Rs. 15000
d)
Rs. 30000
|
|
Learnpro Institute answered |
Given:
In 2023, a part of Rs. 45,000 is invested in company X
The rest was invested in company Y for 1 year
The total interest received is Rs. 3100
Concept Used:
Simple interest (SI) = (P × R × T)/100
Where, P = principal amount, R = rate of interest, and T = time of investment
Calculation:
Let, Rs. a is invested in X and Rs. (45000 - a) is invested in Y
According to the question,
(6a/100) + (45000 - a) × 8/100 = 3100
⇒ 6a + 360000 - 8a = 310000
⇒ 2a = 50000
⇒ a = 25000
∴ The amount invested in X was Rs. 25000
The following line graph gives the ratio of the amounts of imports by a company to the amount of exports from that company over the period from 1995 to 2001.In how many of the given years were the exports more than the imports ?- a)1
- b)2
- c)3
- d)4
Correct answer is option 'D'. Can you explain this answer?
The following line graph gives the ratio of the amounts of imports by a company to the amount of exports from that company over the period from 1995 to 2001.
In how many of the given years were the exports more than the imports ?
a)
1
b)
2
c)
3
d)
4
|
|
Surbhi Joshi answered |
The exports are more than the imports imply that the ratio of value of imports to exports is less than 1.
Now, this ratio is less than 1 in years 1995, 1996, 1997 and 2000.
Thus, there are four such years.
Instructions:
For the following three questions: Answer the questions based on the pie charts given below. Chart 1 shows the distribution of 12 million tonnes of crude oil transported through different modes over a specific period of time. Chart 2 shows the distribution of the cost of transporting this crude oil. The total cost was Rs. 30 million.
 Q. If the costs per tonne of transport by ship, air and road are represented by P, Q and R respectively, which of the following is true?
- a)R > Q > P
- b)P > Q > R
- c)P > R > Q
- d)R > P > Q
Correct answer is option 'B'. Can you explain this answer?
Instructions:
For the following three questions: Answer the questions based on the pie charts given below. Chart 1 shows the distribution of 12 million tonnes of crude oil transported through different modes over a specific period of time. Chart 2 shows the distribution of the cost of transporting this crude oil. The total cost was Rs. 30 million.
Q. If the costs per tonne of transport by ship, air and road are represented by P, Q and R respectively, which of the following is true?
a)
R > Q > P
b)
P > Q > R
c)
P > R > Q
d)
R > P > Q

|
Riverdale Learning Institute answered |
If the costs per tonne of transport by ship, air and road are represented by P, Q and R respectively.
P = 10/9
Q = 7/11
R = 6/22
Q = 7/11
R = 6/22
We can see that P>Q and Q>R and P>R.
Directions: The following line graph shows the data of rate of interests provided by company X and Y in the following 5 years, 2020, 2021, 2022, 2023,and 2024. (all the interest rates are simple interest rate)
 A person invested Rs. 12,500 in company X in the year 2020 for 1 year. If he had invested the same amount in company Y for one year in 2020, how much less amount would he earn than?
- a)Rs. 200
- b)Rs. 250
- c)Rs. 500
- d)Rs. 550
Correct answer is option 'B'. Can you explain this answer?
Directions: The following line graph shows the data of rate of interests provided by company X and Y in the following 5 years, 2020, 2021, 2022, 2023,and 2024. (all the interest rates are simple interest rate)
A person invested Rs. 12,500 in company X in the year 2020 for 1 year. If he had invested the same amount in company Y for one year in 2020, how much less amount would he earn than?
a)
Rs. 200
b)
Rs. 250
c)
Rs. 500
d)
Rs. 550

|
Wizius Careers answered |
Given:
A person invested Rs. 12,500 in company X in the year 2020 for 1 year
Concept Used:
Simple interest (SI) = (P × R × T)/100
Where, P = principal amount, R = rate of interest, and T = time of investment
Calculation:
The interest received from X = (12500 × 12)/100 = Rs. 1500
The interest received from Y = (12500 × 10)/100 = Rs. 1250
He would earn (1500 - 1250) = Rs. 250 less from Y than X
∴ The correct answer is option 2
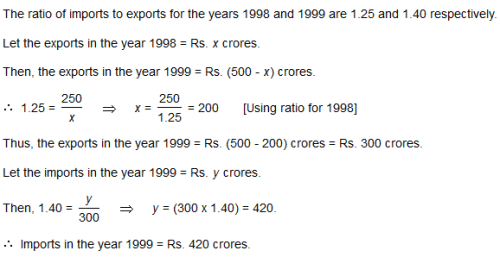
Practice Quiz or MCQ (Multiple Choice Questions) with solutions are available for Practice, which would help you prepare for "Line Charts" under LR and DI. You can practice these practice quizzes as per your speed and improvise the topic. The same topic is covered under various competitive examinations like - CAT, GMAT, Bank PO, SSC and other competitive examinations.Q.The following line graph gives the ratio of the amounts of imports by a company to the amount of exports from that company over the period from 1995 to 2001.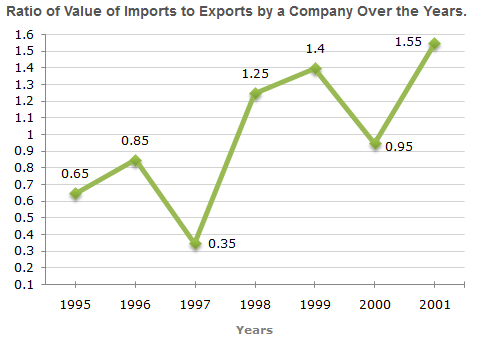 If the imports in 1998 was Rs. 250 crores and the total exports in the years 1998 and 1999 together was Rs. 500 crores, then the imports in 1999 was ?
- a)Rs. 250 crores
- b)Rs. 300 crores
- c)Rs. 357 crores
- d)Rs. 420 crores
Correct answer is option 'D'. Can you explain this answer?
Practice Quiz or MCQ (Multiple Choice Questions) with solutions are available for Practice, which would help you prepare for "Line Charts" under LR and DI. You can practice these practice quizzes as per your speed and improvise the topic. The same topic is covered under various competitive examinations like - CAT, GMAT, Bank PO, SSC and other competitive examinations.
Q.
The following line graph gives the ratio of the amounts of imports by a company to the amount of exports from that company over the period from 1995 to 2001.
If the imports in 1998 was Rs. 250 crores and the total exports in the years 1998 and 1999 together was Rs. 500 crores, then the imports in 1999 was ?
a)
Rs. 250 crores
b)
Rs. 300 crores
c)
Rs. 357 crores
d)
Rs. 420 crores
|
|
Anjana Banerjee answered |
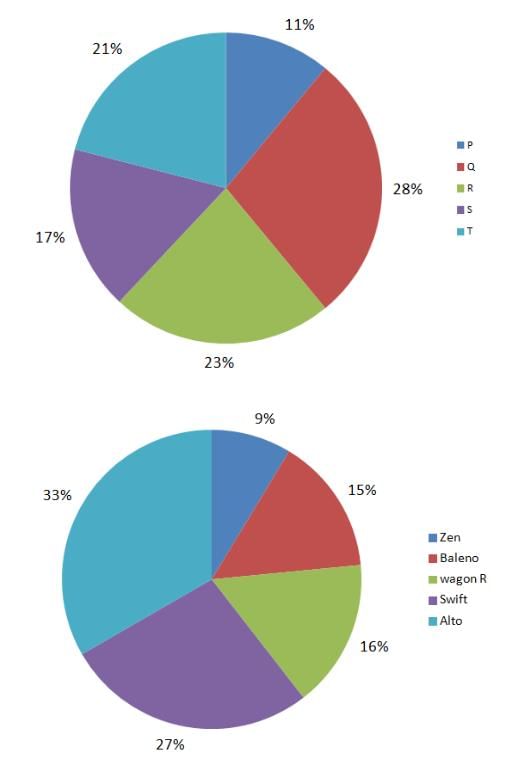
Instructions: On the basis of the information given below, answer the questions that follow.Maruti Suzuki has tie-ups with five dealers in Allahabad to sell their cars. The first pie chart given below gives the dealer-wise break-up of the number of cars sold by Maruti Suzuki in Allahabad in 2015. The second pie chart shows the model-wise breakup of the total cars sold by Maruti Suzuki in 2015 in Allahabad.

Q. If the dealer T sold an equal number of all five models of Maruti Suzuki then what is the maximum share(in %) that T can have in total sales of any model?(Enter only the integer value rounded off to nearest integer. Don’t put % sign)- a)27
- b)57
- c)47
- d)17
Correct answer is option 'C'. Can you explain this answer?
Instructions: On the basis of the information given below, answer the questions that follow.
Maruti Suzuki has tie-ups with five dealers in Allahabad to sell their cars. The first pie chart given below gives the dealer-wise break-up of the number of cars sold by Maruti Suzuki in Allahabad in 2015. The second pie chart shows the model-wise breakup of the total cars sold by Maruti Suzuki in 2015 in Allahabad.
Q. If the dealer T sold an equal number of all five models of Maruti Suzuki then what is the maximum share(in %) that T can have in total sales of any model?(Enter only the integer value rounded off to nearest integer. Don’t put % sign)
Q. If the dealer T sold an equal number of all five models of Maruti Suzuki then what is the maximum share(in %) that T can have in total sales of any model?(Enter only the integer value rounded off to nearest integer. Don’t put % sign)
a)
27
b)
57
c)
47
d)
17

|
Iq Funda answered |
If dealer T sold an equal number of each model, then for each model his share would be 4.2%.
Hence his share would be maximum for the model which had least share among the total sales.
The least share is for Zen which is 9%
Hence, the maximum share that T can have for any model = 4.2/9 × 100
= 46.67% which on rounding off becomes 47%.
Hence the required integral value to be entered is 47.
Directions: The following line graph shows the data of rate of interests provided by company X and Y in the following 5 years, 2020, 2021, 2022, 2023,and 2024. (all the interest rates are simple interest rate)
 In 2024, an amount of 1 Lac is invested in company X for 1 year and after that the total amount received is invested in company Y for 1 year in 2025. Find the total amount received after these two years. (The interest rate of 2025 for Y is the same as 2024)
- a)Rs. 124000
- b)Rs. 124200
- c)Rs. 123200
- d)Rs. 124500
Correct answer is option 'B'. Can you explain this answer?
Directions: The following line graph shows the data of rate of interests provided by company X and Y in the following 5 years, 2020, 2021, 2022, 2023,and 2024. (all the interest rates are simple interest rate)
In 2024, an amount of 1 Lac is invested in company X for 1 year and after that the total amount received is invested in company Y for 1 year in 2025. Find the total amount received after these two years. (The interest rate of 2025 for Y is the same as 2024)
a)
Rs. 124000
b)
Rs. 124200
c)
Rs. 123200
d)
Rs. 124500
|
|
Aspire Academy answered |
Given:
In 2024, an amount of 1 Lac is invested in company X for 1 year
The total amount received is invested in company Y for 1 year in 2025
The interest rate of 2025 for Y is the same as 2024
Concept Used:
Simple interest (SI) = (P × R × T)/100
Where, P = principal amount, R = rate of interest, and T = time of investment
Calculation:
Amount received from X in 1 year = 100000 + (100000 × 8)/100 = Rs. 108000
Amount received from Y in 2025 = 108000 + (108000 × 15)/100 = Rs. 124200
∴ The correct answer is option 2
The following line graph gives the ratio of the amounts of imports by a company to the amount of exports from that company over the period from 1995 to 2001.The imports were minimum proportionate to the exports of the company in the year ?- a)1995
- b)1996
- c)1997
- d)2000
Correct answer is option 'C'. Can you explain this answer?
The following line graph gives the ratio of the amounts of imports by a company to the amount of exports from that company over the period from 1995 to 2001.
The imports were minimum proportionate to the exports of the company in the year ?
a)
1995
b)
1996
c)
1997
d)
2000
|
|
Shreya Rane answered |
The imports are minimum proportionate to the exports implies that the ratio of the value of imports to exports has the minimum value.
Now, this ratio has a minimum value 0.35 in 1997, i.e., the imports are minimum proportionate to the exports in 1997.
The following pie-chart shows the percentage distribution of the expenditure incurred in publishing a book. Study the pie-chart and the answer the questions based on it.Various Expenditures (in percentage) Incurred in Publishing a Book
 Q. The price of the book is marked 20% above the C.P. If the marked price of the book is Rs. 180, then what is the cost of the paper used in a single copy of the book?
- a)Rs. 36
- b)Rs. 42
- c)Rs. 37.50
- d)Rs. 44.25
Correct answer is option 'C'. Can you explain this answer?
The following pie-chart shows the percentage distribution of the expenditure incurred in publishing a book. Study the pie-chart and the answer the questions based on it.
Various Expenditures (in percentage) Incurred in Publishing a Book
Q. The price of the book is marked 20% above the C.P. If the marked price of the book is Rs. 180, then what is the cost of the paper used in a single copy of the book?
a)
Rs. 36
b)
Rs. 42
c)
Rs. 37.50
d)
Rs. 44.25
|
|
Upsc Rank Holders answered |
Clearly, marked price of the book = 120% of C.P.
Also, cost of paper = 25% of C.P
Let the cost of paper for a single book be Rs. n.
Then, 120 : 25 = 180 : n

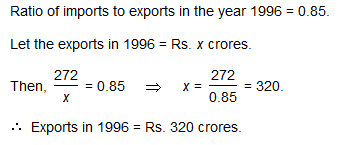
The following line graph gives the ratio of the amounts of imports by a company to the amount of exports from that company over the period from 1995 to 2001.If the imports of the company in 1996 was Rs. 272 crores, the exports from the company in 1996 was ?- a)Rs. 370 crores
- b)Rs. 320 crores
- c)Rs. 280 crores
- d)Rs. 275 crores
Correct answer is option 'B'. Can you explain this answer?
The following line graph gives the ratio of the amounts of imports by a company to the amount of exports from that company over the period from 1995 to 2001.
If the imports of the company in 1996 was Rs. 272 crores, the exports from the company in 1996 was ?
a)
Rs. 370 crores
b)
Rs. 320 crores
c)
Rs. 280 crores
d)
Rs. 275 crores
|
|
Anjana Banerjee answered |
Instructions Chart 1 shows the distribution by value of top 6 suppliers of MFA Textiles in 1995. Chart 2 shows the distribution by quantity of top 6 suppliers of MFA Textiles in 1995. The total value is 5760 million Euro (European currency). The total quantity is 1.055 million tonnes.
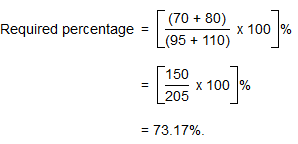
 Q. The average price in Euro per kilogram for Turkey is roughly
- a)6.20
- b)4.80
- c)4.20
- d)5.60
Correct answer is option 'D'. Can you explain this answer?
Instructions
Chart 1 shows the distribution by value of top 6 suppliers of MFA Textiles in 1995. Chart 2 shows the distribution by quantity of top 6 suppliers of MFA Textiles in 1995. The total value is 5760 million Euro (European currency). The total quantity is 1.055 million tonnes.
Q. The average price in Euro per kilogram for Turkey is roughly
a)
6.20
b)
4.80
c)
4.20
d)
5.60
|
|
S.S Career Academy answered |
Turkey has a value of 16% and a quantity of 15%.
The average price in Euro per kilogram for Turkey is (16*5.760)/(15*1.055) which is nearly equal to 5.6.
Hence option D.
Instructions: On the basis of the information given below, answer the questions that follow.Maruti Suzuki has tie-ups with five dealers in Allahabad to sell their cars. The first pie chart given below gives the dealer-wise break-up of the number of cars sold by Maruti Suzuki in Allahabad in 2015. The second pie chart shows the model-wise breakup of the total cars sold by Maruti Suzuki in 2015 in Allahabad.
 Q. If the dealers R and S sold only Zen, Baleno and swift then at least what percentage of the Swifts sold, were sold by these two dealers alone? (Enter only the integer value rounded off to nearest integer. Don’t put % sign)
- a)63
- b)84
- c)59
- d)33
Correct answer is option 'C'. Can you explain this answer?
Instructions: On the basis of the information given below, answer the questions that follow.
Maruti Suzuki has tie-ups with five dealers in Allahabad to sell their cars. The first pie chart given below gives the dealer-wise break-up of the number of cars sold by Maruti Suzuki in Allahabad in 2015. The second pie chart shows the model-wise breakup of the total cars sold by Maruti Suzuki in 2015 in Allahabad.
Q. If the dealers R and S sold only Zen, Baleno and swift then at least what percentage of the Swifts sold, were sold by these two dealers alone? (Enter only the integer value rounded off to nearest integer. Don’t put % sign)
a)
63
b)
84
c)
59
d)
33
|
|
Iq Funda answered |
If the number of swifts sold by R and S is to be minimum, R and S should sell a maximum number of Baleno and Zen.
The share of R and S in total sales is 40%.
So even if they sell all Baleno’s and Zen that will account to only 24%, so they together will sell 16% Swifts.
The total share of swifts is 27% so they sold 16%.
Hence percentage share would be 16/27 × 100
= 59.25% which on rounding off becomes 59%. So correct answer is 59.
Instructions: The pie chart shown below gives the percentage distribution of car sales (in
numbers) between five companies – Maruti, Honda, Hyundai, Ford and Tata during the year 2014 – 2015. The total number of cars sold by the five companies together in 2014-2015 is four hundred thousand.
The line graph shown below gives the percentage distribution of the number of cars sold by each of the five companies in the four different Quarters of the year.
Q. In how many quarters were the number of cars sold by any two companies in that quarter the same?- a)0
- b)1
- c)3
- d)2
Correct answer is option 'D'. Can you explain this answer?
Instructions: The pie chart shown below gives the percentage distribution of car sales (in
numbers) between five companies – Maruti, Honda, Hyundai, Ford and Tata during the year 2014 – 2015. The total number of cars sold by the five companies together in 2014-2015 is four hundred thousand.
The line graph shown below gives the percentage distribution of the number of cars sold by each of the five companies in the four different Quarters of the year.
Q. In how many quarters were the number of cars sold by any two companies in that quarter the same?
a)
0
b)
1
c)
3
d)
2

|
G.K Academy answered |
The data given in the pie chart and the line chart can be tabulated into the following table (Data is in 000’s):
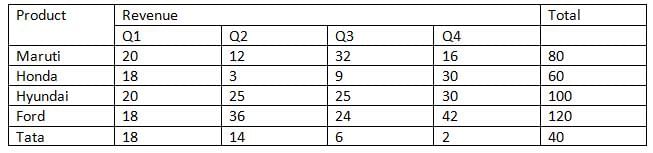
We can see that in Q1 and Q4 there are companies which sold equal number of cars. Thus, D is the right choice.
The bar graph given below shows the sales of books (in thousand number) from six branches of a publishing company during two consecutive years 2000 and 2001.
Sales of Books (in thousand numbers) from Six Branches - B1, B2, B3, B4, B5, and B6 of a publishing Company in 2000 amd 2001.
Q. What is the average sales of all the branches (in thousand numbers) for the year 2000?- a)73
- b)80
- c)83
- d)88
Correct answer is option 'B'. Can you explain this answer?
The bar graph given below shows the sales of books (in thousand number) from six branches of a publishing company during two consecutive years 2000 and 2001.
Sales of Books (in thousand numbers) from Six Branches - B1, B2, B3, B4, B5, and B6 of a publishing Company in 2000 amd 2001.
Q. What is the average sales of all the branches (in thousand numbers) for the year 2000?
Sales of Books (in thousand numbers) from Six Branches - B1, B2, B3, B4, B5, and B6 of a publishing Company in 2000 amd 2001.
Q. What is the average sales of all the branches (in thousand numbers) for the year 2000?
a)
73
b)
80
c)
83
d)
88
|
|
Sreemoyee Dey answered |
Average sales of all the six branches (in thousand number) for the year 2000
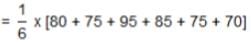
= 80.
= 80.
Instructions Chart 1 shows the distribution by value of top 6 suppliers of MFA Textiles in 1995. Chart 2 shows the distribution by quantity of top 6 suppliers of MFA Textiles in 1995. The total value is 5760 million Euro (European currency). The total quantity is 1.055 million tonnes.
 Q. The country which has the highest average price is
- a)Switzerland
- b)USA
- c)Turkey
- d)India
Correct answer is option 'A'. Can you explain this answer?
Instructions
Chart 1 shows the distribution by value of top 6 suppliers of MFA Textiles in 1995. Chart 2 shows the distribution by quantity of top 6 suppliers of MFA Textiles in 1995. The total value is 5760 million Euro (European currency). The total quantity is 1.055 million tonnes.
Q. The country which has the highest average price is
a)
Switzerland
b)
USA
c)
Turkey
d)
India

|
EduRev CLAT answered |
The country which has the highest average price would have low quality and high value when compared to other countries..
Switzerland fits the above description.
Hence, option A is the answer.
Instructions: On the basis of the information given below, answer the questions that follow.Maruti Suzuki has tie-ups with five dealers in Allahabad to sell their cars. The first pie chart given below gives the dealer-wise break-up of the number of cars sold by Maruti Suzuki in Allahabad in 2015. The second pie chart shows the model-wise breakup of the total cars sold by Maruti Suzuki in 2015 in Allahabad.
 Q. If for any dealer, the percentage of Wagon R’s sold by him did not exceed 25% of his total sales, then at least how many dealers sold Wagon R?
- a)8
- b)3
- c)11
- d)17
Correct answer is option 'B'. Can you explain this answer?
Instructions: On the basis of the information given below, answer the questions that follow.
Maruti Suzuki has tie-ups with five dealers in Allahabad to sell their cars. The first pie chart given below gives the dealer-wise break-up of the number of cars sold by Maruti Suzuki in Allahabad in 2015. The second pie chart shows the model-wise breakup of the total cars sold by Maruti Suzuki in 2015 in Allahabad.
Q. If for any dealer, the percentage of Wagon R’s sold by him did not exceed 25% of his total sales, then at least how many dealers sold Wagon R?
a)
8
b)
3
c)
11
d)
17
|
|
Iq Funda answered |
We have to minimize the number of dealers who sold Wagon R.
So to minimize the number of dealers, the dealers who have largest share in total sales should have maximum share of Wagon R.
So if we assume that Q and R sold Wagon R the maximum number of Wagon R’s they can sell is 25% of 51 which is equal to 12.75%.
But the overall share of Wagon R is 16% so there should be at least 1 more dealer who sells Wagon R.
Hence the correct answer is 3.
Instructions:
For the following three questions: Answer the questions based on the pie charts given below. Chart 1 shows the distribution of 12 million tonnes of crude oil transported through different modes over a specific period of time. Chart 2 shows the distribution of the cost of transporting this crude oil. The total cost was Rs. 30 million.
 Q. From the charts given, it appears that the cheapest mode of transport is
- a)road
- b)rail
- c)pipeline
- d)ship
Correct answer is option 'A'. Can you explain this answer?
Instructions:
For the following three questions: Answer the questions based on the pie charts given below. Chart 1 shows the distribution of 12 million tonnes of crude oil transported through different modes over a specific period of time. Chart 2 shows the distribution of the cost of transporting this crude oil. The total cost was Rs. 30 million.
Q. From the charts given, it appears that the cheapest mode of transport is
a)
road
b)
rail
c)
pipeline
d)
ship

|
Innovative Classes answered |
Cheapest mode of transport will be the one which will have highest transport volume and comparatively lowest cost.
We can figure out from the graph that Road have wide gap with very less costs.
For Road, Cost = 6/22
For Rail, Cost = 12/9
For Pipeline, = 65/49
For Ship, Cost = 10/9
Lowest cost is for road.
Directions: The following line graph shows the data of rate of interests provided by company X and Y in the following 5 years, 2020, 2021, 2022, 2023,and 2024. (all the interest rates are simple interest rate)
 Two different amounts in the ratio 8 : 15 are invested in X and Y respectively in 2022. Then find the ratio of the amount received after 1 year for X to Y.
- a)167 : 315
- b)176 : 315
- c)176 : 351
- d)167 : 351
Correct answer is option 'B'. Can you explain this answer?
Directions: The following line graph shows the data of rate of interests provided by company X and Y in the following 5 years, 2020, 2021, 2022, 2023,and 2024. (all the interest rates are simple interest rate)
Two different amounts in the ratio 8 : 15 are invested in X and Y respectively in 2022. Then find the ratio of the amount received after 1 year for X to Y.
a)
167 : 315
b)
176 : 315
c)
176 : 351
d)
167 : 351

|
Spectrum Coaching Institute answered |
Given:
Two different amounts in the ratio 8 : 15 are invested in X and Y respectively in 2022
Concept Used:
Simple interest (SI) = (P × R × T)/100
Where, P = principal amount, R = rate of interest, and T = time of investment
Calculation:
Let, the amount invested in X is = 8a, and in Y is = 15a in 2022
The amount received from X = 8a + (8a × 10)/100 = Rs. (88a/10)
The amount received from Y = 15a + (15a × 5)/100 = Rs. (63a/4)
The respective ratio of amount received from X and Y is
⇒ (88a/10) : (63a/4) = 176 : 315
∴ The correct answer is option 2
Chapter doubts & questions for Data graphs - General Aptitude for GATE 2025 is part of Mechanical Engineering exam preparation. The chapters have been prepared according to the Mechanical Engineering exam syllabus. The Chapter doubts & questions, notes, tests & MCQs are made for Mechanical Engineering 2025 Exam. Find important definitions, questions, notes, meanings, examples, exercises, MCQs and online tests here.
Chapter doubts & questions of Data graphs - General Aptitude for GATE in English & Hindi are available as part of Mechanical Engineering exam.
Download more important topics, notes, lectures and mock test series for Mechanical Engineering Exam by signing up for free.
General Aptitude for GATE
206 videos|190 docs|158 tests
|
|
© EduRev
|
Education Revolution
|


|


Signup to see your scores
go up within 7 days!
Access 1000+ FREE Docs, Videos and Tests
Takes less than 10 seconds to signup