


All Exams >
Civil Engineering (CE) >
Engineering Hydrology >
All Questions
All questions of Runoff & Hydrographs for Civil Engineering (CE) Exam
The flow-mass curve is an integral curve of- a)the hydrograph
- b)the hyetograph
- c)the flow duration curve
- d)the S-curve
Correct answer is option 'A'. Can you explain this answer?
The flow-mass curve is an integral curve of
a)
the hydrograph
b)
the hyetograph
c)
the flow duration curve
d)
the S-curve

|
Maulik Joshi answered |
The flow mass curve is a plot of the cumulative discharge volume against time plotted in chronological order. The ordinate of the mass curve, V at any time t is,

Since the hydrograph is a plot of Q vs t, it is easy that the flow mass curve is an integral curve of the hydrograph.
Since the hydrograph is a plot of Q vs t, it is easy that the flow mass curve is an integral curve of the hydrograph.

The shape of the recession limb of a hydrograph depends on- a)basin as well as storm characteristics
- b)storm characteristics only
- c)basin characteristics only
- d)base flow only
Correct answer is option 'C'. Can you explain this answer?
The shape of the recession limb of a hydrograph depends on
a)
basin as well as storm characteristics
b)
storm characteristics only
c)
basin characteristics only
d)
base flow only
|
|
Zoya Sharma answered |
The climatic factors control the rising iimb and the recession limb is independent of storm characteristics, being determined by catchment characteristics only.
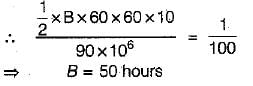
A 90 km2 catchment has a 4-h unit hydrograph which can be approximated as a triangle. If the peak ordinate of this unit hydrograph is 10m3/s the time base is- a)120h
- b)64 h
- c)50 h
- d)None of these
Correct answer is option 'C'. Can you explain this answer?
A 90 km2 catchment has a 4-h unit hydrograph which can be approximated as a triangle. If the peak ordinate of this unit hydrograph is 10m3/s the time base is
a)
120h
b)
64 h
c)
50 h
d)
None of these
|
|
Abhay Kapoor answered |
Let the time base = B(hours)
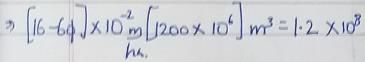
The total rainfall in a catchment of area 1200 km2 during a 6-h storm is 16 cm while the surface runoff due to the storm is 1.2 x 10⁸ m3. The φ-index is- a)0.1 cm/h
- b)1.0 cm/h
- c)0.2 cm/h
- d)cannot be estimated with the given data
Correct answer is option 'B'. Can you explain this answer?
The total rainfall in a catchment of area 1200 km2 during a 6-h storm is 16 cm while the surface runoff due to the storm is 1.2 x 10⁸ m3. The φ-index is
a)
0.1 cm/h
b)
1.0 cm/h
c)
0.2 cm/h
d)
cannot be estimated with the given data
|
|
Mahesh Nair answered |


The flow-duration curve is a plot of- a)accumulated flow againsttime
- b)discharge against time in chronological order
- c)the base flow against the percentage of times the flow is exceeded
- d)the stream discharge against the percentage of times the flow is equalled or exceeded
Correct answer is option 'D'. Can you explain this answer?
The flow-duration curve is a plot of
a)
accumulated flow againsttime
b)
discharge against time in chronological order
c)
the base flow against the percentage of times the flow is exceeded
d)
the stream discharge against the percentage of times the flow is equalled or exceeded
|
|
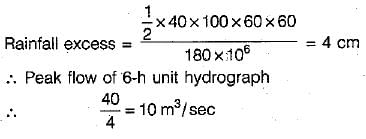
Rahul Chauhan answered |
A flow-duration curve of a stream is a plot of discharge against the per cent of time the flow was equalled or exceeded. This curve is also known as discharge frequency curve.
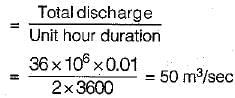
A triangular DRH due to a 6-h storm in a catchment has a time base of 100 h and a peak flow of 40 m3/s. The catchment area is 180 km2. The 6-h unit hydrograph of this catchment will have a peak flow in m3/s of- a)10
- b)20
- c)30
- d)None of these
Correct answer is option 'A'. Can you explain this answer?
A triangular DRH due to a 6-h storm in a catchment has a time base of 100 h and a peak flow of 40 m3/s. The catchment area is 180 km2. The 6-h unit hydrograph of this catchment will have a peak flow in m3/s of
a)
10
b)
20
c)
30
d)
None of these
|
|
Maulik Das answered |
A flood-hydrograph due to an isolated storm consists of- a)surface runoff, interflow, and base flow phases
- b)surface runoff only
- c)base flow only
- d)surface runoff and base flow phases only
Correct answer is option 'A'. Can you explain this answer?
A flood-hydrograph due to an isolated storm consists of
a)
surface runoff, interflow, and base flow phases
b)
surface runoff only
c)
base flow only
d)
surface runoff and base flow phases only
|
|
Bhaskar Rane answered |
Hydrographs and Flood Events
A hydrograph is a graphical representation of the flow rate or discharge of a river or channel over a specific period of time. It depicts the rise and fall of water levels in response to precipitation, and is commonly used in hydrology and hydraulic engineering to analyze flood events.
Isolated Storm and Flood Hydrograph
An isolated storm refers to a singular rainfall event that occurs over a relatively short period of time, typically within a few hours. When this storm occurs, it can produce a flood hydrograph that illustrates the changes in river discharge over time. The flood hydrograph resulting from an isolated storm typically consists of three distinct phases: surface runoff, interflow, and base flow.
Surface Runoff
Surface runoff is the portion of precipitation that flows over the ground surface and eventually enters streams or rivers. It occurs when the rate of rainfall exceeds the infiltration rate of the soil, causing excess water to flow overland. Surface runoff is a major contributor to flood events, as it can rapidly increase river discharge. In the flood hydrograph, the surface runoff phase is characterized by a steep rising limb, indicating a rapid increase in river discharge.
Interflow
Interflow refers to the lateral movement of water within the soil, just below the ground surface. It occurs when the soil becomes saturated and excess water starts to move horizontally through the soil layers. Interflow contributes to the overall flow of water towards streams or rivers, but its contribution to flood events is relatively smaller compared to surface runoff. In the flood hydrograph, the interflow phase is represented by a slower rising limb, indicating a gradual increase in river discharge.
Base Flow
Base flow is the portion of streamflow that is sustained by groundwater seepage into a river or channel. It represents the long-term average flow of a river under normal weather conditions, and it is typically lower than the peak flow associated with flood events. However, during a flood event, the base flow can contribute to the overall river discharge. In the flood hydrograph, the base flow phase is depicted by a relatively flat portion after the peak flow, indicating a gradual recession of river discharge.
Conclusion
In summary, the flood hydrograph resulting from an isolated storm consists of three phases: surface runoff, interflow, and base flow. Surface runoff is the primary contributor to flood events, as it represents the rapid increase in river discharge during heavy rainfall. Interflow and base flow play smaller roles in flood events but contribute to the overall hydrograph shape. Understanding the different phases of a flood hydrograph is crucial for analyzing and managing flood risk in hydraulic engineering and hydrology.
If a 4-hour unit hydrograph of a certain basin has a peak ordinate of 80 m3/s, the peak ordinate of a 2-hour unit hydrograph for the same basin will be- a)equal to 80 m3/s
- b)greater than 80 m3/s
- c)less than 80 m3/s
- d)between 40 m3/s to 80 m3/s
Correct answer is option 'B'. Can you explain this answer?
If a 4-hour unit hydrograph of a certain basin has a peak ordinate of 80 m3/s, the peak ordinate of a 2-hour unit hydrograph for the same basin will be
a)
equal to 80 m3/s
b)
greater than 80 m3/s
c)
less than 80 m3/s
d)
between 40 m3/s to 80 m3/s
|
|
Arnab Choudhury answered |
With the reduction of unit hydrograph duration, 1 cm excess rainfall will occur in reduced period. So peak ordinate of UH will increase and time base will decrease. Thus the peak ordinate of 2 hr UH will be greater than 80 m3/s.
Virgin flow is- a)the flow in the river downstream of a gauging station
- b)the flow in the river upstream of a gauging station
- c)the flow unaffected by works of man
- d)the flow that would exist in the stream if there were no abstractions to the precipitation
Correct answer is option 'C'. Can you explain this answer?
Virgin flow is
a)
the flow in the river downstream of a gauging station
b)
the flow in the river upstream of a gauging station
c)
the flow unaffected by works of man
d)
the flow that would exist in the stream if there were no abstractions to the precipitation
|
|
Ashish Chakraborty answered |
A stream flow unaffected by works of man, such as structures for storage and diversion on a stream is called virgin flow.
The point of inflection on the recession limb of a hydrograph represents- a)the cessation of rainfall
- b)the condition of maximum storage in the catchment
- c)the end of base flow
- d)peak runoff rate
Correct answer is option 'B'. Can you explain this answer?
The point of inflection on the recession limb of a hydrograph represents
a)
the cessation of rainfall
b)
the condition of maximum storage in the catchment
c)
the end of base flow
d)
peak runoff rate
|
|
Rohan Singh answered |
The starting point of the recession limb, i.e., the point of inflection represents the condition of maximum storage.
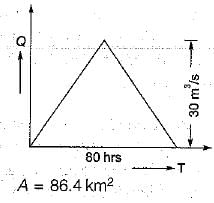
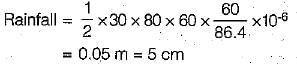
The direct runoff hydrograph of a storm obtained from a catchment is triangular in shape and has a base period of 80 hours. The peak flow rate is 30m3/sec and catchment area is 86.4 km2. The rainfall excess that has resulted the above hydrograph is- a)5 cm
- b)8 cm
- c)10 cm
- d)16 cm
Correct answer is option 'A'. Can you explain this answer?
The direct runoff hydrograph of a storm obtained from a catchment is triangular in shape and has a base period of 80 hours. The peak flow rate is 30m3/sec and catchment area is 86.4 km2. The rainfall excess that has resulted the above hydrograph is
a)
5 cm
b)
8 cm
c)
10 cm
d)
16 cm
|
|
Sanya Agarwal answered |
An intermittent stream- a)has water table above the stream bed throughout the year
- b)has only flash flows in response to storms
- c)has flows in the stream during wet season due to contribution of ground water
- d)does not have any contribution of ground water at any time
Correct answer is option 'C'. Can you explain this answer?
An intermittent stream
a)
has water table above the stream bed throughout the year
b)
has only flash flows in response to storms
c)
has flows in the stream during wet season due to contribution of ground water
d)
does not have any contribution of ground water at any time

|
Ameya Sen answered |
An intermittent stream has limited contribution from the groundwater. During the wet season the water table is above the stream bed and there is a contribution of the base flow to the stream flow.
An instantaneous unit hydrograph is a direct runoff hydrograph- a)of 1 cm magnitude due to a rainfall excess of 1-h duration
- b)that occurs instantaneously due to a unit rainfall excess of duration-D h
- c)of unit rainfall excess precipitating instantaneously over the catchment
- d)occurring at any instant in a long storm
Correct answer is option 'C'. Can you explain this answer?
An instantaneous unit hydrograph is a direct runoff hydrograph
a)
of 1 cm magnitude due to a rainfall excess of 1-h duration
b)
that occurs instantaneously due to a unit rainfall excess of duration-D h
c)
of unit rainfall excess precipitating instantaneously over the catchment
d)
occurring at any instant in a long storm
|
|
Prashanth Mehra answered |
Explanation:
An instantaneous unit hydrograph is a hydrograph that represents the direct runoff response of a catchment to a unit rainfall excess that occurs instantaneously over the catchment. It is a fundamental concept in hydrology and is widely used in the analysis and design of stormwater management systems.
Key Points:
- Direct Runoff: An instantaneous unit hydrograph represents the direct runoff component of the total streamflow. It does not include the baseflow component, which is the groundwater contribution to streamflow.
- Unit Rainfall Excess: The unit rainfall excess refers to a rainfall excess of a unit magnitude, such as 1 cm or 1 inch. It is the portion of rainfall that exceeds the infiltration capacity of the catchment and directly contributes to streamflow.
- Instantaneous Precipitation: The unit rainfall excess is assumed to occur instantaneously over the catchment. This means that the entire unit excess rainfall is assumed to be applied to the catchment at a single point in time.
- Catchment Response: The instantaneous unit hydrograph represents the response of the catchment to the unit rainfall excess. It shows how the streamflow hydrograph changes over time in response to the input of rainfall.
- Duration: The instantaneous unit hydrograph does not have a specific duration. It is a theoretical concept that represents the response of a catchment to a unit rainfall excess regardless of the duration of the excess rainfall.
Conclusion:
In summary, an instantaneous unit hydrograph is a hydrograph that represents the direct runoff response of a catchment to a unit rainfall excess that occurs instantaneously over the catchment. It is a theoretical concept that helps in understanding the relationship between rainfall and streamflow in a catchment.
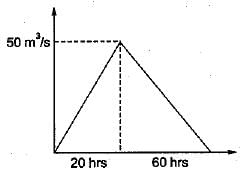
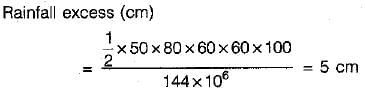
A triangular DRH due to a storm has a time base of 80 hrs and a peak flow of 50 m3/s occurring at 20 hours from the start, if the catchment area is 144 km2, the rainfall excess in the storm was- a)20 cm
- b)7.2 cm
- c)5 cm
- d)None of these
Correct answer is option 'C'. Can you explain this answer?
A triangular DRH due to a storm has a time base of 80 hrs and a peak flow of 50 m3/s occurring at 20 hours from the start, if the catchment area is 144 km2, the rainfall excess in the storm was
a)
20 cm
b)
7.2 cm
c)
5 cm
d)
None of these
|
|
Muskaan Sen answered |
The term base flow denotes- a)delayed groundwater flow reaching a stream
- b)delayed groundwater and snowmelt reaching a stream
- c)delayed groundwater and interflow
- d)the annual minimum flow in a stream
Correct answer is option 'A'. Can you explain this answer?
The term base flow denotes
a)
delayed groundwater flow reaching a stream
b)
delayed groundwater and snowmelt reaching a stream
c)
delayed groundwater and interflow
d)
the annual minimum flow in a stream
|
|
Rithika Kaur answered |
The delayed flow that reaches a stream essentially as groundwater flow is called base flow.
Direct runoff is made up of- a)surface runoff, prompt interflow and channel precipitation
- b)surface run off, infiltration and evapotranspiration
- c)overland flow only
- d)rainfall and evaporation
Correct answer is option 'A'. Can you explain this answer?
Direct runoff is made up of
a)
surface runoff, prompt interflow and channel precipitation
b)
surface run off, infiltration and evapotranspiration
c)
overland flow only
d)
rainfall and evaporation
|
|
Sanvi Kapoor answered |
Direct runoff is that part of runoff which enters the stream immediately after the precipitation. It includes surface runoff, prompt interflow and precipitation on the channel surface.
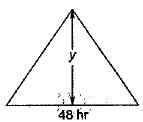
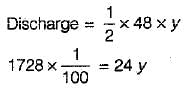
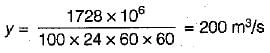
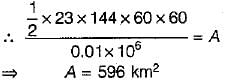
A 12-hr unit hydrograph of a catchment is triangular in shape with a base width of 144 hours and a peak discharge value of 23 m3/s. This unit hydrograph refers to a catchment of area- a)756 km2
- b)596 km2
- c)1000 km2
- d)None of these
Correct answer is option 'B'. Can you explain this answer?
A 12-hr unit hydrograph of a catchment is triangular in shape with a base width of 144 hours and a peak discharge value of 23 m3/s. This unit hydrograph refers to a catchment of area
a)
756 km2
b)
596 km2
c)
1000 km2
d)
None of these
|
|
Madhurima Banerjee answered |
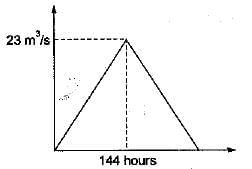
Unit hydrograph refers to 1 cm of rainfall excess
∴ Let area of catchment = A(km2)
In an influent stream- a)there is a contribution from the groundwater to the stream due to seepage
- b)there is a contribution from the stream to the groundwater due to percolation
- c)there is a seepage of groundwater into the stream at the sides and percolation of stream flow water at the bed
- d)there will be neither seepage into the stream nor percolation from the stream to the groundwater
Correct answer is option 'B'. Can you explain this answer?
In an influent stream
a)
there is a contribution from the groundwater to the stream due to seepage
b)
there is a contribution from the stream to the groundwater due to percolation
c)
there is a seepage of groundwater into the stream at the sides and percolation of stream flow water at the bed
d)
there will be neither seepage into the stream nor percolation from the stream to the groundwater
|
|
Aarav Kulkarni answered |
If the bed of the stream is below the groundwater table, during period of low flows in the stream, the water surface may go down below the general water table elevation and the groundwater contributes to the flow in the stream such stream which receive groundwater flow are called effluent stream water percolates to the groundwater storage and a hump is formed in the groundwater table. Such streams which contribute to the groundwater are known as influent streams.
In Synder’s method of synthetic unit hydrograph development, basin lag is taken as- a)the time interval between centroid of the rainfall excess and surface runoff
- b)the time interval from mid point of the unit rainfall excess to the peak of the unit hydrograph
- c)independent of rainfall duration
- d)independent of catchment characteristics
Correct answer is option 'B'. Can you explain this answer?
In Synder’s method of synthetic unit hydrograph development, basin lag is taken as
a)
the time interval between centroid of the rainfall excess and surface runoff
b)
the time interval from mid point of the unit rainfall excess to the peak of the unit hydrograph
c)
independent of rainfall duration
d)
independent of catchment characteristics
|
|
Shail Rane answered |
The most important characteristic of a basin affecting a hydrograph due to a given storm is basin lag. Basin lag is the time difference between the centroids of the input (rainfall excess) and the output (surface runoff).
For a given storm, other factors remaining same,- a)basins having Sow drainage density give smaller peaks in flood hydrographs
- b)basins with larger drainage densities give smaller flood peaks
- c)low drainage density basins give shorter time bases of hydrographs
- d)the flood peak is independent of the drainage density
Correct answer is option 'A'. Can you explain this answer?
For a given storm, other factors remaining same,
a)
basins having Sow drainage density give smaller peaks in flood hydrographs
b)
basins with larger drainage densities give smaller flood peaks
c)
low drainage density basins give shorter time bases of hydrographs
d)
the flood peak is independent of the drainage density
|
|
Saptarshi Khanna answered |
The drainage density is defined as the ratio of the total channel length to the total drainage area. A large drainage density creates situation conductive for quick disposal of runoff drawn the channels.
If the base period of a 6-hour hydrograph of a basin is 84 hours, then a 12 hours unit hydrograph derived from this 6 hour unit hydrograph wii! have a base period of - a)72 hours
- b)78 hours .
- c)84 hours
- d)90 hours
Correct answer is option 'D'. Can you explain this answer?
If the base period of a 6-hour hydrograph of a basin is 84 hours, then a 12 hours unit hydrograph derived from this 6 hour unit hydrograph wii! have a base period of
a)
72 hours
b)
78 hours .
c)
84 hours
d)
90 hours
|
|
Aditi Sarkar answered |
Understanding Hydrographs
In hydrology, hydrographs represent the flow of water over time at a specific location. The unit hydrograph is a vital tool used to analyze the response of a watershed to rainfall.
Base Period of Hydrographs
- The base period of a hydrograph refers to the time duration over which the flow is measured.
- For a 6-hour hydrograph, the base period is indicated as 84 hours.
Deriving Unit Hydrographs
- When deriving a 12-hour unit hydrograph from a 6-hour unit hydrograph, the base period changes.
- The relationship between different unit hydrographs can be understood through the concept of superposition and scaling.
Calculating the Base Period for the 12-Hour Unit Hydrograph
- To derive the 12-hour unit hydrograph, the base period is extended.
- The original hydrograph (6-hour) has a base period of 84 hours.
- When creating a 12-hour unit hydrograph, the base period is adjusted to accommodate the new duration.
Final Base Period Determination
- The base period for the new unit hydrograph can be calculated as:
- Original Base Period + (Difference in Time Durations).
- Therefore, 84 hours + 6 hours (since 12 hours - 6 hours) gives us 90 hours.
Conclusion
- The correct answer is option 'D' (90 hours) because the base period of the derived 12-hour unit hydrograph is indeed extended to 90 hours to accurately represent the watershed's response over the new duration.
A storm hydrograph was due to 3 h of effective rainfall. It contained 6 cm of direct runoff. The ordinates of DRH of this storm- a)When divided by 3 give the ordinates of a 6-hunit hydrograph
- b)When divided by 6 give the oridinates of a 3-h unit hydrograph
- c)When divided by 3 give the ordinates of a 3-h unit hydrograph
- d)When divided by 6 give the ordinates of a 6-h unit hydrograph
Correct answer is option 'B'. Can you explain this answer?
A storm hydrograph was due to 3 h of effective rainfall. It contained 6 cm of direct runoff. The ordinates of DRH of this storm
a)
When divided by 3 give the ordinates of a 6-hunit hydrograph
b)
When divided by 6 give the oridinates of a 3-h unit hydrograph
c)
When divided by 3 give the ordinates of a 3-h unit hydrograph
d)
When divided by 6 give the ordinates of a 6-h unit hydrograph
|
|
Sahil Mehra answered |
Explanation:
To understand the given question, let's break it down into smaller parts and analyze each part separately.
Given Information:
- Effective rainfall duration: 3 hours
- Direct runoff: 6 cm
Now, let's go through each part of the question and understand what it means.
a) When divided by 3, give the ordinates of a 6-h unit hydrograph:
When we divide the direct runoff hydrograph (DRH) by 3, we are essentially trying to determine the unit hydrograph for a 6-hour duration storm event.
The unit hydrograph represents the direct runoff response to a unit depth of rainfall over a specific duration. In this case, the unit hydrograph represents the direct runoff response to a 1 cm depth of rainfall over a 6-hour duration.
So, when we divide the DRH by 3, we are essentially converting the 3-hour effective rainfall into a 6-hour unit hydrograph. This means that each ordinate of the resulting hydrograph represents the runoff response to a 1 cm depth of rainfall over a 6-hour duration.
b) When divided by 6, give the ordinates of a 3-h unit hydrograph:
Similarly, when we divide the DRH by 6, we are trying to determine the unit hydrograph for a 3-hour duration storm event.
So, each ordinate of the resulting hydrograph represents the runoff response to a 1 cm depth of rainfall over a 3-hour duration.
c) When divided by 3, give the ordinates of a 3-h unit hydrograph:
This option is incorrect because dividing the DRH by 3 would not give the ordinates of a 3-hour unit hydrograph. Dividing by 3 would result in a hydrograph representing the runoff response to a 1 cm depth of rainfall over a 1-hour duration.
d) When divided by 6, give the ordinates of a 6-h unit hydrograph:
This option is also incorrect because dividing the DRH by 6 would not give the ordinates of a 6-hour unit hydrograph. Dividing by 6 would result in a hydrograph representing the runoff response to a 1 cm depth of rainfall over a 0.5-hour (30 minutes) duration.
Therefore, the correct answer is option 'B' - When divided by 6, the ordinates of the DRH give the ordinates of a 3-hour unit hydrograph.
An intermittent river- a)carries water only after rains
- b)carries water only after snowmelt
- c)carries water most of the time but ceases to flow occasionally
- d)carries water all the time except during extreme droughts
Correct answer is option 'C'. Can you explain this answer?
An intermittent river
a)
carries water only after rains
b)
carries water only after snowmelt
c)
carries water most of the time but ceases to flow occasionally
d)
carries water all the time except during extreme droughts
|
|
Poulomi Patel answered |
Intermittent River:
Intermittent rivers are those rivers that do not flow consistently throughout the year. They may have periods where they are dry and periods where they carry water.
Characteristics of an Intermittent River:
- Carries water most of the time: An intermittent river typically carries water most of the time but may cease to flow occasionally.
- Occasional dry periods: During dry periods, an intermittent river may have no flow or very little flow.
- Dependent on rainfall: The flow of water in an intermittent river is often dependent on rainfall. After a heavy rain, the river may start flowing, but it may stop again during dry spells.
- Variable flow: The flow of water in an intermittent river can vary greatly depending on the amount of precipitation in the area.
Explanation:
Option C, "carries water most of the time but ceases to flow occasionally," is the correct answer because intermittent rivers typically have water flowing in them for a significant portion of the year. However, there are periods when the flow may stop temporarily due to lack of rainfall or other factors. This intermittent flow pattern distinguishes intermittent rivers from perennial rivers, which have water flowing in them year-round.
When an accumulated mass of snow melts, the resulting flow entering a stream is classified as- a)direct runoff
- b)base flow
- c)subsurface flow
- d)interflow
Correct answer is option 'A'. Can you explain this answer?
When an accumulated mass of snow melts, the resulting flow entering a stream is classified as
a)
direct runoff
b)
base flow
c)
subsurface flow
d)
interflow
|
|
Pranavi Choudhury answered |
Direct Runoff from Melting Snow
Direct runoff is the flow of water that occurs immediately after precipitation or snowmelt. When an accumulated mass of snow melts, the resulting flow entering a stream is classified as direct runoff. This runoff is generated when the snow melts and runs off the surface of the ground into nearby streams, rivers, and lakes.
Factors Affecting Direct Runoff
Several factors can affect the amount of direct runoff generated from melting snow, including:
- Temperature: Warmer temperatures can cause snow to melt more quickly, resulting in a higher volume of direct runoff.
- Precipitation: Heavy precipitation can cause larger amounts of snow to accumulate, resulting in a higher volume of direct runoff when it melts.
- Topography: The slope and shape of the land can affect the rate and volume of direct runoff.
- Vegetation: Vegetation can slow down the rate of direct runoff by absorbing water from the ground and holding it for a longer period.
Importance of Direct Runoff
Direct runoff is an important source of water for streams, rivers, and lakes. It can also cause flooding and erosion if it occurs too quickly or in large volumes. Understanding the factors that affect direct runoff can help engineers and planners design better stormwater management systems to protect against flooding and erosion.
Conclusion
In summary, direct runoff is the flow of water that occurs immediately after precipitation or snowmelt. When an accumulated mass of snow melts, the resulting flow entering a stream is classified as direct runoff. Several factors can affect the amount of direct runoff generated from melting snow, including temperature, precipitation, topography, and vegetation. Direct runoff is an important source of water for streams, rivers, and lakes, but it can also cause flooding and erosion if not managed properly.
A unit hydrograph has- a)one unit of peak discharge
- b)one unit of rainfall duration
- c)one unit of direct runoff
- d)one unit of the time base of direct runoff
Correct answer is option 'C'. Can you explain this answer?
A unit hydrograph has
a)
one unit of peak discharge
b)
one unit of rainfall duration
c)
one unit of direct runoff
d)
one unit of the time base of direct runoff
|
|
Parth Patel answered |
Unit Hydrograph Explanation:
Unit hydrograph is a hydrological tool used to represent the response of a watershed to a unit input of rainfall. It helps in predicting the direct runoff hydrograph resulting from a given rainfall event.
Key Components of a Unit Hydrograph:
- One unit of direct runoff: This is the key component of a unit hydrograph. It represents the total volume of direct runoff generated by a unit input of rainfall over a specific watershed area.
- One unit of peak discharge: The peak discharge is the maximum flow rate in the hydrograph. In a unit hydrograph, the peak discharge is normalized to one unit for ease of comparison and analysis.
- One unit of rainfall duration: This represents the duration of the unit rainfall input that results in the generation of the unit direct runoff. It helps in understanding the time distribution of runoff.
- One unit of the time base of direct runoff: The time base of direct runoff is the time interval between the start and end of direct runoff. In a unit hydrograph, this time base is normalized to one unit for standardization purposes.
Conclusion:
In summary, a unit hydrograph consists of one unit of direct runoff, which is the total volume of runoff generated by a unit input of rainfall. This component is crucial in understanding the response of a watershed to different rainfall events and is fundamental in hydrological analysis and modeling.
In India, a meteorological subdivision is considered to be affected by moderate drought if it receives a total seasonal rainfall which is- a)less than 25% of normal value
- b)between 25% to 49% of normal value
- c)between 50% to 74% of normal value
- d)between 75% to 99% of normal value
Correct answer is option 'C'. Can you explain this answer?
In India, a meteorological subdivision is considered to be affected by moderate drought if it receives a total seasonal rainfall which is
a)
less than 25% of normal value
b)
between 25% to 49% of normal value
c)
between 50% to 74% of normal value
d)
between 75% to 99% of normal value
|
|
Moumita Rane answered |
Moderate Drought in India based on Seasonal Rainfall
Definition of Moderate Drought in India
In India, a meteorological subdivision is considered to be affected by moderate drought when it receives a total seasonal rainfall that is between 50% to 74% of the normal value.
Explanation of the Answer
India is a country that largely depends on agriculture for its economy. Therefore, it is essential to understand the different levels of drought that can affect the country's agricultural productivity. The Indian Meteorological Department (IMD) classifies drought based on the amount of rainfall received in a particular season.
When the total seasonal rainfall is less than 75% of the normal value, it is considered to be a drought. The IMD classifies drought into four categories based on the severity of the situation. These categories are meteorological drought, agricultural drought, hydrological drought, and socio-economic drought.
Meteorological drought occurs when there is a significant reduction in rainfall in a particular season. Agricultural drought occurs when the lack of rainfall affects crops and livestock. Hydrological drought occurs when there is a significant reduction in water supply, such as rivers and reservoirs. Socio-economic drought occurs when the lack of rainfall affects the economy and the livelihoods of people.
Moderate drought is the second level of drought severity in India. It occurs when the total seasonal rainfall is between 50% to 74% of the normal value. This level of drought can affect crops and livestock and can also lead to a reduction in water supply.
Conclusion
In conclusion, moderate drought in India occurs when a meteorological subdivision receives a total seasonal rainfall that is between 50% to 74% of the normal value. This level of drought can affect agricultural productivity and lead to a reduction in water supply. It is essential to understand the different levels of drought severity to take appropriate measures to mitigate the adverse effects of drought on the economy and the livelihoods of people.
An ephemeral stream- a)is one which always carries some flow
- b)does not have any base flow contribution
- c)is one which has limited contribution of groundwater in wet season
- d)is one which carries only snowmelt water
Correct answer is option 'B'. Can you explain this answer?
An ephemeral stream
a)
is one which always carries some flow
b)
does not have any base flow contribution
c)
is one which has limited contribution of groundwater in wet season
d)
is one which carries only snowmelt water

|
Swati Patel answered |
An ephemeral stream
An ephemeral stream is a type of stream that does not have any base flow contribution. Unlike perennial streams, which have a consistent flow throughout the year, ephemeral streams only flow during certain periods, typically after rainfall events or during the melting of snow. These streams are also known as intermittent or seasonal streams.
Characteristics of ephemeral streams
Ephemeral streams exhibit several characteristics that differentiate them from perennial streams:
1. Intermittent flow: Ephemeral streams only flow intermittently and do not have a continuous flow throughout the year. They are usually dry or have a very low flow during dry periods, such as summer or drought conditions.
2. Limited contribution of groundwater: Unlike perennial streams, which receive a significant contribution of base flow from groundwater, ephemeral streams have limited or no contribution from groundwater. They primarily rely on surface runoff from precipitation or snowmelt for their flow.
3. Dependent on rainfall: The flow in ephemeral streams is highly dependent on rainfall events. After a significant rainfall, the stream channel fills up with water and carries the runoff downstream. However, once the rainfall stops, the flow diminishes and eventually ceases.
4. Variable channel morphology: Ephemeral streams often have a variable channel morphology due to the sporadic nature of their flow. During periods of flow, the stream erodes the channel bed and banks, creating a dynamic and ever-changing channel shape.
5. Ecological significance: Although ephemeral streams may not have a constant flow, they still play a vital role in the ecosystem. They provide habitat for a variety of plants and animals that have adapted to survive in these intermittent water conditions.
Importance and challenges
Understanding ephemeral streams is crucial for various engineering and environmental applications, including water resource management, flood control, and ecological conservation. However, their intermittent nature poses challenges for water management and infrastructure development.
1. Water resource management: Ephemeral streams contribute to the overall water availability in a region, particularly during wet seasons. The intermittent flow can impact water availability for human consumption, agriculture, and industrial use.
2. Flood control: Ephemeral streams can experience flash floods during heavy rainfall events. These sudden surges of water can pose a significant risk to downstream areas, requiring appropriate flood control measures to protect life and property.
3. Ecological conservation: Ephemeral streams support unique ecosystems and provide essential habitats for various species. Protecting and preserving these streams is crucial for maintaining biodiversity and ecological balance.
In conclusion, an ephemeral stream is a stream that does not have any base flow contribution. It flows intermittently, relying on surface runoff from rainfall or snowmelt. Understanding the characteristics and significance of ephemeral streams is essential for effective water management and environmental conservation.
Unit hydrograph are generally used for
1. developing flood hydrographs for extreme rainfall magnitudes for the design of hydraulic structures.
2. extending flood flow records by using the available rainfall records.
3. developing flood forecasting and warning system based on rainfall data.
The correct answer is- a)both 1 and 2
- b)only 3
- c)both 2 and 3
- d)1, 2 and 3
Correct answer is option 'D'. Can you explain this answer?
Unit hydrograph are generally used for
1. developing flood hydrographs for extreme rainfall magnitudes for the design of hydraulic structures.
2. extending flood flow records by using the available rainfall records.
3. developing flood forecasting and warning system based on rainfall data.
The correct answer is
1. developing flood hydrographs for extreme rainfall magnitudes for the design of hydraulic structures.
2. extending flood flow records by using the available rainfall records.
3. developing flood forecasting and warning system based on rainfall data.
The correct answer is
a)
both 1 and 2
b)
only 3
c)
both 2 and 3
d)
1, 2 and 3

|
Prashanth Rane answered |
Unit hydrographs are widely used in hydrology for various purposes. They are graphical representations of the runoff response of a watershed to a unit amount of rainfall over a specific duration. They are derived by analyzing the relationship between rainfall and resulting streamflow.
- Developing flood hydrographs for extreme rainfall magnitudes for the design of hydraulic structures:
Unit hydrographs are commonly used in the design of hydraulic structures such as dams, reservoirs, and culverts. By analyzing the response of a watershed to a unit amount of rainfall, engineers can estimate the peak flow rates and volumes that would occur during extreme rainfall events. This information is crucial for designing hydraulic structures that can safely accommodate these flows without causing flooding or structural failure.
- Extending flood flow records by using the available rainfall records:
In many cases, the available streamflow data for a watershed may be limited or incomplete. Unit hydrographs can be used to extend the flood flow records by using the available rainfall records. By applying the unit hydrograph to the rainfall data, the resulting streamflow hydrograph can be obtained. This helps in understanding the historical flood events and predicting the future flood behavior of the watershed.
- Developing flood forecasting and warning system based on rainfall data:
Unit hydrographs are an essential tool for developing flood forecasting and warning systems. By analyzing the relationship between rainfall and streamflow, hydrologists can estimate the response time of a watershed to rainfall events. This allows for the prediction of flood peaks and the timing of their occurrence. By incorporating real-time rainfall data into the unit hydrograph analysis, flood forecasts can be generated, and appropriate warnings can be issued to the public.
In conclusion, unit hydrographs are used for developing flood hydrographs for extreme rainfall magnitudes, extending flood flow records, and developing flood forecasting and warning systems. Therefore, the correct answer is option D, which states that unit hydrographs are used for all three purposes.
If in a flow-mass curve, a demand line drawn tangent to the lowest point in a valley of the cure does not intersect the mass curve at an earlier time period, it represents that- a)the storage is inadequate
- b)the reservoir will not be full at the start of the dry period
- c)the reservoir is full at the beginning of the dry period
- d)the reservoir is wasting water by spill
Correct answer is option 'B'. Can you explain this answer?
If in a flow-mass curve, a demand line drawn tangent to the lowest point in a valley of the cure does not intersect the mass curve at an earlier time period, it represents that
a)
the storage is inadequate
b)
the reservoir will not be full at the start of the dry period
c)
the reservoir is full at the beginning of the dry period
d)
the reservoir is wasting water by spill

|
Arshiya Dasgupta answered |
Explanation:
The flow-mass curve is a graphical representation of the variation of discharge (flow) and storage volume (mass) of a reservoir over time. When a demand line is drawn tangent to the lowest point in a valley of the curve, it represents the minimum demand that must be met during the dry period. If this demand line does not intersect the mass curve at an earlier time period, it indicates that the reservoir will not be full at the start of the dry period.
Reason:
The reason behind this is that the reservoir has not stored enough water during the wet period to meet the minimum demand during the dry period. This can be due to inadequate storage capacity or insufficient inflow during the wet period. As a result, the reservoir may not be able to supply water at the required rate during the dry period, leading to water shortages.
Conclusion:
Therefore, option B - the reservoir will not be full at the start of the dry period - is the correct answer. This situation highlights the importance of proper planning and management of water resources to ensure adequate storage capacity and inflow during the wet period to meet the demands during the dry period.
In a flow-mass curve study the demand line drawn from a ridge in the curve did not interest the mass curve again. This represents that- a)the reservoir was not full at the beginning
- b)the storage was not adequate
- c) the demand cannot be met by the inflow as the reservoir will not refill
- d)the reservoir is wasting water by spill
Correct answer is option 'C'. Can you explain this answer?
In a flow-mass curve study the demand line drawn from a ridge in the curve did not interest the mass curve again. This represents that
a)
the reservoir was not full at the beginning
b)
the storage was not adequate
c)
the demand cannot be met by the inflow as the reservoir will not refill
d)
the reservoir is wasting water by spill
|
|
Juhi Choudhary answered |
Explanation:
Flow-mass curve is a graphical representation of water inflow and outflow from a reservoir over a period of time. The curve is used to analyze the water storage and supply capacity of a reservoir. The demand line on the curve represents the amount of water required by the consumers, and the ridge on the curve represents the maximum available storage capacity of the reservoir.
When the demand line drawn from a ridge in the curve does not intersect with the mass curve again, it means that the reservoir is not able to refill to its maximum capacity. This indicates that the inflow of water into the reservoir is not sufficient to meet the demand for water by the consumers. The following are the reasons why the demand cannot be met by the inflow as the reservoir will not refill:
Insufficient inflow: The inflow of water into the reservoir may be insufficient due to low rainfall or drought conditions in the catchment area. This will cause the reservoir to have less water than required.
Leakage: The reservoir may have leaks or seepage that cause water loss. This will reduce the total amount of water available for supply.
Increased demand: The demand for water may have increased beyond the capacity of the reservoir to supply. This may be due to population growth or increased usage of water for irrigation or industrial purposes.
Conclusion:
In conclusion, the flow-mass curve study is an important tool for analyzing the water storage and supply capacity of a reservoir. When the demand line drawn from a ridge in the curve does not intersect with the mass curve again, it indicates that the demand cannot be met by the inflow as the reservoir will not refill. This may be due to insufficient inflow, leakage, or increased demand.
The drainage density is the- a)average length of the streams per unit drainage area within the basin
- b)stream discharge per unit drainage area
- c)annual runoff per unit drainage area
- d)number of streams per unit drainage area
Correct answer is option 'A'. Can you explain this answer?
The drainage density is the
a)
average length of the streams per unit drainage area within the basin
b)
stream discharge per unit drainage area
c)
annual runoff per unit drainage area
d)
number of streams per unit drainage area
|
|
Sravya Rane answered |
Understanding Drainage Density
Drainage density is a crucial concept in hydrology and civil engineering that reflects how water flows through a landscape. It provides insight into the efficiency of a watershed in draining excess water.
Definition of Drainage Density
- Average Length of Streams: Drainage density is defined as the average length of all streams and rivers within a given drainage basin per unit area of that basin.
- Mathematical Expression: It can be expressed as:
- Drainage Density = Total Length of Streams / Total Drainage Area
Importance of Drainage Density
- Hydrological Response: A higher drainage density indicates a more efficient drainage system, leading to quicker runoff and potentially higher flood risks.
- Soil and Vegetation Impact: Areas with high drainage density often have less water retention, affecting soil moisture and vegetation types.
- Land Use Planning: Engineers and planners utilize drainage density to assess flood management strategies, design infrastructure, and predict environmental impacts.
Comparing Options
- Option A (Correct): Accurately describes drainage density as the average length of streams per unit area.
- Option B (Incorrect): Refers to stream discharge, which is not related to the length of streams.
- Option C (Incorrect): Discusses annual runoff, a different hydrological measurement.
- Option D (Incorrect): Mentions the number of streams, but density focuses on length relative to area, not just quantity.
Conclusion
Understanding drainage density is vital for effective water management, land use planning, and environmental conservation. It helps engineers and hydrologists predict how landscapes will behave under different water flow conditions.
Streams intersecting the water table, and receiving flow from the groundwater are known as- a)influent streams
- b)effluent streams
- c)ephemeral streams
- d)subsurface streams
Correct answer is option 'B'. Can you explain this answer?
Streams intersecting the water table, and receiving flow from the groundwater are known as
a)
influent streams
b)
effluent streams
c)
ephemeral streams
d)
subsurface streams

|
Kiran Gupta answered |
Effluent Streams
Effluent streams are those streams that intersect the water table and receive flow from the groundwater. These streams are also known as gaining streams. The term "effluent" is used because these streams contribute to the groundwater outflow or discharge.
Influent Streams
In contrast, influent streams are those that lose water to the groundwater system. They are also known as losing streams because their flow is reduced as they lose water to the groundwater.
Ephemeral Streams
Ephemeral streams are those streams that only flow for a short period of time after rainfall or snowmelt. These streams are not fed by groundwater and do not intersect the water table.
Subsurface Streams
Subsurface streams are those that flow underground through permeable rocks or soils. These streams are not visible on the surface and can only be detected through monitoring of groundwater levels or through the use of specialized tools such as boreholes and wells.
In conclusion, effluent streams are streams that intersect the water table and receive flow from the groundwater, while influent streams lose water to the groundwater system. Ephemeral streams only flow after rainfall or snowmelt and do not intersect the water table, while subsurface streams flow underground through permeable rocks or soils.
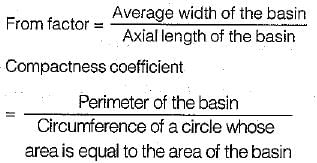
Compactness coefficient of a basin is defined as- a)

- b)

- c)

- d)

Correct answer is option 'C'. Can you explain this answer?
Compactness coefficient of a basin is defined as
a)
b)
c)
d)
|
|
Lavanya Menon answered |
Shape of a drainage basin is generally expressed by ‘form factor' and ‘compactness coefficient’.
The D-hour unit hydrograph of a catchment may be obtained by dividing the ordinates of a single peak Direct Runoff Hydrograph (DRH) due to a storm of D-hour duration by the- a)Total runoff volume (in cm)
- b)Direct runoff volume (in cm)
- c)Duration of DRH
- d)Total rainfall (in cm)
Correct answer is option 'B'. Can you explain this answer?
The D-hour unit hydrograph of a catchment may be obtained by dividing the ordinates of a single peak Direct Runoff Hydrograph (DRH) due to a storm of D-hour duration by the
a)
Total runoff volume (in cm)
b)
Direct runoff volume (in cm)
c)
Duration of DRH
d)
Total rainfall (in cm)
|
|
Bhavya Ahuja answered |
Understanding D-hour Unit Hydrograph
The D-hour unit hydrograph (UH) is a crucial tool in hydrology, representing the response of a catchment to a unit input of rainfall over a specific duration (D hours). To derive this hydrograph from a Direct Runoff Hydrograph (DRH), the ordinates of the peak DRH must be normalized.
Why Option B is Correct
To calculate the D-hour unit hydrograph, the ordinates of the DRH are divided by the direct runoff volume. Here’s why:
Why Other Options are Incorrect
In summary, dividing by the direct runoff volume allows for a clear understanding of the catchment's hydrological response, which is essential for effective water resource management.
The D-hour unit hydrograph (UH) is a crucial tool in hydrology, representing the response of a catchment to a unit input of rainfall over a specific duration (D hours). To derive this hydrograph from a Direct Runoff Hydrograph (DRH), the ordinates of the peak DRH must be normalized.
Why Option B is Correct
To calculate the D-hour unit hydrograph, the ordinates of the DRH are divided by the direct runoff volume. Here’s why:
- Direct Runoff Volume: This represents the total volume of water that contributes directly to streamflow from the storm event. It excludes baseflow and other contributions, focusing solely on runoff.
- Normalization: By dividing the ordinates of the peak DRH by the direct runoff volume, we get a per-unit response of the catchment. This helps in understanding how much runoff results from each unit of rainfall, making the UH a useful predictive tool for future storm events.
- Unit Hydrograph Concept: The essence of the unit hydrograph is to express the hydrograph in terms of a unit input (1 cm of direct runoff). This allows engineers to scale the response for different rainfall events by simply multiplying the UH by the corresponding direct runoff volume from a storm.
Why Other Options are Incorrect
- Total Runoff Volume: This includes both direct runoff and baseflow, which is not relevant for UH calculation.
- Duration of DRH: Dividing by this would not provide a meaningful normalization in the context of hydrological response.
- Total Rainfall: This does not accurately reflect the efficiency of the catchment in converting rainfall to runoff.
In summary, dividing by the direct runoff volume allows for a clear understanding of the catchment's hydrological response, which is essential for effective water resource management.
In an S-curve derived by a unit hydrograph U of D-h duration- a)the equilibrium discharge is independent of D
- b)the time base of U represents the time at which the S-curve attains its maximum value
- c)the equilibrium discharge of an S-curve is independent of the catchment area of the basin
- d)the ordinate is in units of volume
Correct answer is option 'B'. Can you explain this answer?
In an S-curve derived by a unit hydrograph U of D-h duration
a)
the equilibrium discharge is independent of D
b)
the time base of U represents the time at which the S-curve attains its maximum value
c)
the equilibrium discharge of an S-curve is independent of the catchment area of the basin
d)
the ordinate is in units of volume
|
|
Rithika Kaur answered |
Explanation:
S-curve derived by a unit hydrograph U of D-h duration represents the cumulative runoff at the outlet of a catchment in response to a unit depth of excess rainfall that is uniformly distributed over the catchment for a duration of D hours.
The correct option is B, i.e., the time base of U represents the time at which the S-curve attains its maximum value. This can be explained as follows:
- Definition of S-curve: An S-curve represents the cumulative runoff at the outlet of a catchment over time, starting from the time of onset of excess rainfall until the runoff ceases.
- Relationship between unit hydrograph and S-curve: The S-curve is derived by convolving the unit hydrograph with excess rainfall of varying duration and intensity. The unit hydrograph represents the response of the catchment to a unit pulse of excess rainfall, and its time base represents the time taken for the peak of the hydrograph to occur.
- Effect of duration on S-curve: As the duration of excess rainfall increases, the volume of runoff also increases, and hence the S-curve attains higher values at later times.
- Effect of time base of U on S-curve: The time base of U determines the time at which the peak of the S-curve occurs. This is because the peak of the S-curve corresponds to the time when the excess rainfall is fully converted to runoff and is equal to the peak flow rate of the unit hydrograph. Hence, the time base of U represents the time at which the S-curve attains its maximum value.
- Other options: Option A is incorrect because the equilibrium discharge depends on the catchment area, and hence on the volume of excess rainfall. Option C is incorrect because the equilibrium discharge depends on the catchment area. Option D is incorrect because the ordinate of the S-curve is in units of volume per unit area, not volume.
A direct-runoff hydrograph due to a storm was found to be triangular in shape with a peak of 150 m3/s, time from start of effective storm to peak of 24 h and a total time base of 72 h. The duration of the storm in this case was- a)< 24 h
- b)between 24 to 72 h
- c)72 h
- d)> 72 h
Correct answer is option 'A'. Can you explain this answer?
A direct-runoff hydrograph due to a storm was found to be triangular in shape with a peak of 150 m3/s, time from start of effective storm to peak of 24 h and a total time base of 72 h. The duration of the storm in this case was
a)
< 24 h
b)
between 24 to 72 h
c)
72 h
d)
> 72 h
|
|
Aditi Sarkar answered |
Explanation:
Duration of the Storm:
- The storm duration can be determined by the time from the start of the effective storm to the peak flow in the direct-runoff hydrograph.
- In this case, the time from the start of the storm to the peak flow is 24 hours.
- Therefore, the storm duration is less than 24 hours.
Calculation:
- The total time base of the direct-runoff hydrograph is 72 hours.
- Since the storm duration is only 24 hours, it is less than the total time base of 72 hours.
- Hence, the correct answer is option 'A' which states that the duration of the storm is less than 24 hours.
The peak discharges in 6 h and 12 h unit hydrographs of a catchment occur at t6 and f12 hours from the start. Then- a)t6 > t12
- b)t6 = t12
- c)t6 < t12
- d)t6 = t12 for triangular UH
Correct answer is option 'C'. Can you explain this answer?
The peak discharges in 6 h and 12 h unit hydrographs of a catchment occur at t6 and f12 hours from the start. Then
a)
t6 > t12
b)
t6 = t12
c)
t6 < t12
d)
t6 = t12 for triangular UH

|
Garima Nambiar answered |
The peak discharge in the 6-hour unit hydrograph occurs at t=6 hours from the start.
The peak discharge in the 12-hour unit hydrograph occurs at t=12 hours from the start.
The peak discharge in the 12-hour unit hydrograph occurs at t=12 hours from the start.
A hydrograph is a plot of- a)rainfall intensity against time
- b)stream discharge against time
- c)cumulative rainfall against time
- d)cumulative runoff against time
Correct answer is option 'B'. Can you explain this answer?
A hydrograph is a plot of
a)
rainfall intensity against time
b)
stream discharge against time
c)
cumulative rainfall against time
d)
cumulative runoff against time

|
Jaya Yadav answered |
Understanding Hydrographs
A hydrograph is a crucial tool used in hydrology and civil engineering to analyze the relationship between rainfall and streamflow. It provides valuable insights into how a watershed responds to precipitation events.
Definition of Hydrograph
- A hydrograph is a graphical representation that plots **stream discharge against time**.
- Discharge, measured in cubic meters per second (m³/s), indicates the volume of water flowing through a river or stream at a given time.
Importance of Hydrographs
- Hydrographs help in understanding the **timing and magnitude** of runoff from a watershed.
- They are instrumental in flood forecasting, water resource management, and designing hydraulic structures.
Components of a Hydrograph
- **Rising Limb**: Indicates the increase in discharge following a rainfall event.
- **Peak Discharge**: The maximum flow rate observed during the event.
- **Falling Limb**: Represents the decrease in discharge as the runoff diminishes.
- **Base Flow**: The normal flow of the river when there is no rainfall.
Applications of Hydrographs
- Used in **flood risk assessment** and management by predicting flood peaks.
- Assists in designing **drainage systems** and stormwater management plans.
- Helps in evaluating the **impact of land use changes** on watershed hydrology.
In summary, the correct answer to the question about hydrographs is option 'B', as it specifically illustrates the behavior of stream discharge over time, providing essential data for various engineering and environmental applications.
If a 4-h unit hydrograph of a catchment has a peak ordinate of 60 m3/s, the peak ordinate of an 8-h unit hydrograph for the same catchment will be- a)> 60 m3/s
- b)- 60 m3/s
- c)< 60 m3/s
- d)Data inadequate
Correct answer is option 'C'. Can you explain this answer?
If a 4-h unit hydrograph of a catchment has a peak ordinate of 60 m3/s, the peak ordinate of an 8-h unit hydrograph for the same catchment will be
a)
> 60 m3/s
b)
- 60 m3/s
c)
< 60 m3/s
d)
Data inadequate

|
Nandita Datta answered |
Peak Ordinate of 4-h vs 8-h Unit Hydrograph
Peak ordinate of a unit hydrograph represents the maximum flow rate at a specific time interval. When comparing the peak ordinates of unit hydrographs for different durations, certain relationships can be observed.
Explanation:
4-h Unit Hydrograph
- Peak ordinate: 60 m3/s
8-h Unit Hydrograph
- The peak ordinate of an 8-h unit hydrograph for the same catchment will be less than 60 m3/s (option C).
- This is because as the duration of the unit hydrograph increases, the peak ordinate typically decreases. This is due to the smoothing effect that occurs as the hydrograph is spread out over a longer time period.
- Therefore, based on the relationship between the peak ordinates of unit hydrographs of different durations, the peak ordinate of an 8-h unit hydrograph would be expected to be less than the peak ordinate of a 4-h unit hydrograph for the same catchment.
Conclusion:
- The peak ordinate of an 8-h unit hydrograph for the same catchment will be less than 60 m3/s.
The recession limb of a flood hydrograph can be expressed with positive values of coefficients, as Qt/Q0 =- a)

- b)

- c)e-at
- d)

Correct answer is option 'C'. Can you explain this answer?
The recession limb of a flood hydrograph can be expressed with positive values of coefficients, as Qt/Q0 =
a)
b)
c)
e-at
d)
|
|
Poulomi Patel answered |
Barnes showed that recession limp of a fleed hydrograph can be expressed as,

where a = -In kr
kr is recession constant of value less than unity. Q0 and Qt are discharges at a time interval of t days with Q0 being the initial discharge.
where a = -In kr
kr is recession constant of value less than unity. Q0 and Qt are discharges at a time interval of t days with Q0 being the initial discharge.
The drainage area of a basin is- a)the surface area of the land enclosed within the divide
- b)the vertical projection of the area enclosed within the divide
- c)the horizontal projection of the area enclosed within the divide
- d)is a fictitious area arbitrarily assigned to a stream
Correct answer is option 'C'. Can you explain this answer?
The drainage area of a basin is
a)
the surface area of the land enclosed within the divide
b)
the vertical projection of the area enclosed within the divide
c)
the horizontal projection of the area enclosed within the divide
d)
is a fictitious area arbitrarily assigned to a stream
|
|
Shounak Saini answered |
Explanation:
Definition of Drainage Area:
The drainage area of a basin refers to the horizontal projection of the area enclosed within the divide. It is the total area from which water drains into a specific river, stream, or watershed.
Importance of Drainage Area:
- The drainage area plays a crucial role in determining the amount of water that flows through a particular channel.
- It helps in understanding the hydrological characteristics of a basin and predicting the potential for flooding or other water-related events.
- By analyzing the drainage area, engineers and hydrologists can design effective water management strategies and infrastructure.
Determining Drainage Area:
- The drainage area is calculated based on the topographic features of the land, such as elevation, slope, and land use.
- It is essential to consider the entire area that contributes water to a particular point in the watershed to accurately determine the drainage area.
Comparison with Other Options:
- Option 'A' is incorrect because the drainage area is not the surface area of the land enclosed within the divide.
- Option 'B' is incorrect as it refers to the vertical projection of the area, which is not the same as the drainage area.
- Option 'D' is incorrect as the drainage area is a real and significant geographical area, not a fictitious one arbitrarily assigned to a stream.
In conclusion, the drainage area of a basin is the horizontal projection of the area enclosed within the divide, and it is a critical factor in hydrological analysis and water resource management.
An area is classified as a drought prone area if the probability P of occurrence of a drought is- a)0.4 < P ≤ 1.0
- b)0.2 ≤ P ≤ 0.40
- c)0.1 ≤ P < 0.20
- d)0.0 < P < 0.20
Correct answer is option 'B'. Can you explain this answer?
An area is classified as a drought prone area if the probability P of occurrence of a drought is
a)
0.4 < P ≤ 1.0
b)
0.2 ≤ P ≤ 0.40
c)
0.1 ≤ P < 0.20
d)
0.0 < P < 0.20
|
|
Manasa Bose answered |
This statement is incomplete. Without knowing the value of P, we cannot determine whether an area is classified as a drought prone area. Please provide the value of P.
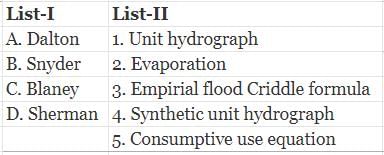
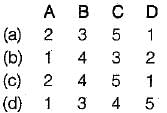
Chapter doubts & questions for Runoff & Hydrographs - Engineering Hydrology 2025 is part of Civil Engineering (CE) exam preparation. The chapters have been prepared according to the Civil Engineering (CE) exam syllabus. The Chapter doubts & questions, notes, tests & MCQs are made for Civil Engineering (CE) 2025 Exam. Find important definitions, questions, notes, meanings, examples, exercises, MCQs and online tests here.
Chapter doubts & questions of Runoff & Hydrographs - Engineering Hydrology in English & Hindi are available as part of Civil Engineering (CE) exam.
Download more important topics, notes, lectures and mock test series for Civil Engineering (CE) Exam by signing up for free.
Engineering Hydrology
20 videos|53 docs|30 tests
|
|
© EduRev
|
Education Revolution
|


|


Signup to see your scores
go up
within 7 days!
within 7 days!
Takes less than 10 seconds to signup