


All Exams >
Civil Engineering (CE) >
RRB JE for Civil Engineering >
All Questions
All questions of Transportation Engineering for Civil Engineering (CE) Exam
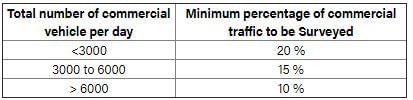
If the total number of commercial vehicles per day ranges from 3000 to 6000, the minimum percentage of commercial traffic to be surveyed for axle load is:- a)15
- b)20
- c)25
- d)30
Correct answer is option 'A'. Can you explain this answer?
If the total number of commercial vehicles per day ranges from 3000 to 6000, the minimum percentage of commercial traffic to be surveyed for axle load is:
a)
15
b)
20
c)
25
d)
30

|
Samarth Ghoshal answered |
Minimum percentage is 15% for axle load determination when commercial vehicles vary from 3000-6000.
Sample size for axle load survey:

While aligning a hill road with a ruling gradient of 6%, a horizontal curve of radius 50 m is encountered. The grade compensation (in percentage up two equal places) to be provided for this case would be _______
Correct answer is between '1.49,1.51'. Can you explain this answer?
While aligning a hill road with a ruling gradient of 6%, a horizontal curve of radius 50 m is encountered. The grade compensation (in percentage up two equal places) to be provided for this case would be _______

|
Sai Sarkar answered |
R = 50
Grade compensation = 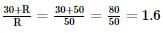
(Grade compensation)max =
Hence, (grade compensation)max = 1.5
(Grade compensation)max =
Hence, (grade compensation)max = 1.5
Engineers India Limited (EIL), a public sector undertaking was set up in 1965. It is the leading design and engineering company in the field of petroleum refineries, petrochemicals, oil and gas processing offshore structures and platforms, fertilisers, metallurgy, and power. The services provided by EIL include design, engineering, procurement construction management, commissioning assistance and project management, besides specialist services in the areas of environmental engineering, heat and mass transfer equipment, information technology materials and maintenance, risk analysis, energy conservation and advance control and optimisation. It has to its credit over 4000 assignments including 250 major projects. EIL has exported its services to a number of countries in Asia and Africa.Q. Engineers India Limited does not deal in which of the following areas?- a)Construction management
- b)Environment management
- c)Heat and mass transfer equipment.
- d)Cement manufacture
Correct answer is option 'D'. Can you explain this answer?
Engineers India Limited (EIL), a public sector undertaking was set up in 1965. It is the leading design and engineering company in the field of petroleum refineries, petrochemicals, oil and gas processing offshore structures and platforms, fertilisers, metallurgy, and power. The services provided by EIL include design, engineering, procurement construction management, commissioning assistance and project management, besides specialist services in the areas of environmental engineering, heat and mass transfer equipment, information technology materials and maintenance, risk analysis, energy conservation and advance control and optimisation. It has to its credit over 4000 assignments including 250 major projects. EIL has exported its services to a number of countries in Asia and Africa.
Q. Engineers India Limited does not deal in which of the following areas?
a)
Construction management
b)
Environment management
c)
Heat and mass transfer equipment.
d)
Cement manufacture

|
Abhishek Mishraclasses answered |
Cement manufacture isn't mentioned in the passage. Hence, EIL does not deal in this area.
A superspeedway in New Delhi has among the highest super-elevation rates of any track on the Indian Grand Prix circuit. The track requires drivers to negotiate turns with a radius of 335 m and 33° banking. Given this information, the coefficient of side friction required in order to allow a vehicle to travel at 320 km/h along the curve is:- a)1.761
- b)0.176
- c)0.253
- d)2.530
Correct answer is option 'A'. Can you explain this answer?
A superspeedway in New Delhi has among the highest super-elevation rates of any track on the Indian Grand Prix circuit. The track requires drivers to negotiate turns with a radius of 335 m and 33° banking. Given this information, the coefficient of side friction required in order to allow a vehicle to travel at 320 km/h along the curve is:
a)
1.761
b)
0.176
c)
0.253
d)
2.530
|
|
Ameya Deshpande answered |
R = 335 m
V = 320 km/hr
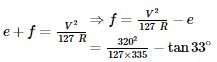
= 1.761
Which of the following statements CANNOT be used to describe free-flow speed (uf) of a traffic stream?- a)uf is the speed when the flow is negligible.
- b)uf is the speed when density is negligible.
- c)uf is affected by geometry and surface conditions of the road.
- d)uf is the speed at which flow is maximum and density is optimum.
Correct answer is option 'D'. Can you explain this answer?
Which of the following statements CANNOT be used to describe free-flow speed (uf) of a traffic stream?
a)
uf is the speed when the flow is negligible.
b)
uf is the speed when density is negligible.
c)
uf is affected by geometry and surface conditions of the road.
d)
uf is the speed at which flow is maximum and density is optimum.
|
|
Kavya Mehta answered |
Explanation:
Free-flow speed (uf) is a fundamental parameter used in traffic engineering and transportation planning. It is defined as the speed at which vehicles would travel if there were no other vehicles on the road. Here are the statements that describe free-flow speed and why option D is incorrect:
Statement A - uf is the speed when the flow is negligible: This statement is correct because free-flow speed is the speed at which vehicles can travel without any interference from other vehicles. When the flow of vehicles is negligible, the free-flow speed is the same as the speed limit on the road.
Statement B - uf is the speed when density is negligible: This statement is also correct because free-flow speed is inversely proportional to traffic density. When the density of vehicles is very low, the free-flow speed is the maximum possible speed on the road.
Statement C - uf is affected by geometry and surface conditions of the road: This statement is correct because the geometry and surface conditions of the road determine the maximum safe speed that vehicles can travel. For example, a road with many curves, steep grades, or poor pavement conditions will have a lower free-flow speed than a straight, flat road with good pavement.
Statement D - uf is the speed at which flow is maximum and density is optimum: This statement is incorrect because the free-flow speed is the speed at which there is no interference from other vehicles. It does not depend on the flow or density of vehicles on the road. The maximum flow and optimum density occur at a different speed, which is known as the critical speed. The critical speed is the speed at which the maximum number of vehicles can pass through a given section of road without causing congestion.
In conclusion, option D is the statement that cannot be used to describe free-flow speed.
In Marshall method of mix design, the coarse aggregate, fine aggregate, fines and bitumen having respective values of specific gravity 2.60, 2.70, 2.65 and 1.01, are mixed in the relative proportions (% by weight) of 55.0, 35.8, 3.7 and 5.5 respectively. The theoretical specific gravity of the mix and the effective specific gravity of the aggregates in the mix respectively are:- a)2.42 and 2.78
- b)2.42 and 2.63
- c)2.42 and 2.93
- d)2.64 and 2.78
Correct answer is option 'B'. Can you explain this answer?
In Marshall method of mix design, the coarse aggregate, fine aggregate, fines and bitumen having respective values of specific gravity 2.60, 2.70, 2.65 and 1.01, are mixed in the relative proportions (% by weight) of 55.0, 35.8, 3.7 and 5.5 respectively. The theoretical specific gravity of the mix and the effective specific gravity of the aggregates in the mix respectively are:
a)
2.42 and 2.78
b)
2.42 and 2.63
c)
2.42 and 2.93
d)
2.64 and 2.78
|
|
Gitanjali Menon answered |
Theoretical specific gravity
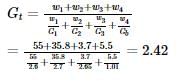
Effective specific gravity of aggregates (coarse + fine) is given by
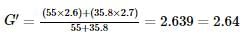
Effective specific gravity of aggregates (coarse + fine) is given by
The penetration value of a bitumen sample tested at 25°C is 80. When this sample is heated to 60°C and tested again, the needle of the penetration test apparatus penetrates the bitumen sample by d mm. The value of d CANNOT be less than _______________ mm.
Correct answer is '8'. Can you explain this answer?
The penetration value of a bitumen sample tested at 25°C is 80. When this sample is heated to 60°C and tested again, the needle of the penetration test apparatus penetrates the bitumen sample by d mm. The value of d CANNOT be less than _______________ mm.
|
|
Poulomi Khanna answered |
The penetration value is 1/10th of the bitumen sample grade.
The penetration value of 80 means the needle of the penetration test apparatus penetrates the bitumen sample by 80/10= 8 mm
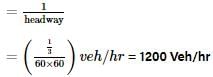
On a circular curve, the rate of super-elevation is e. While negotiating the curve a vehicle comes to a stop. It is seen that the stopped vehicle does not slide inwards (in the radial direction). The coefficient of side friction is f. Which of the following is true:- a)e ≤ f
- b)f < e < 2f
- c)e ≥ 2f
- d)None of the above
Correct answer is option 'A'. Can you explain this answer?
On a circular curve, the rate of super-elevation is e. While negotiating the curve a vehicle comes to a stop. It is seen that the stopped vehicle does not slide inwards (in the radial direction). The coefficient of side friction is f. Which of the following is true:
a)
e ≤ f
b)
f < e < 2f
c)
e ≥ 2f
d)
None of the above
|
|
Anagha Mehta answered |
For equilibrium
fN ≥ mg sin θ
⇒ fmg cos θ ≥ mg sin θ
⇒ fcos θ ≥ sin θ
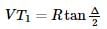
⇒ f ≥ tan θ
⇒ f ≥ e
While traveling along and against the traffic stream, a moving observer measured the relative flows as 50 vehicles/hr and 200 vehicles/hr, respectively. The average speeds of the moving observer while traveling along and against the stream are 20 km/hr and 30 km/hr, respectively. The density of the traffic stream (expressed in vehicles/km) is
Correct answer is between '2.9,3.1'. Can you explain this answer?
While traveling along and against the traffic stream, a moving observer measured the relative flows as 50 vehicles/hr and 200 vehicles/hr, respectively. The average speeds of the moving observer while traveling along and against the stream are 20 km/hr and 30 km/hr, respectively. The density of the traffic stream (expressed in vehicles/km) is
|
|
Milan Ghosh answered |
Calculating Traffic Density:
- The formula to calculate traffic density is given by:
Density = Flow / Speed
Calculating Traffic Density while traveling along the traffic stream:
- Flow along the traffic stream = 50 vehicles/hr
- Speed along the traffic stream = 20 km/hr
- Density along the traffic stream = 50 / 20 = 2.5 vehicles/km
Calculating Traffic Density while traveling against the traffic stream:
- Flow against the traffic stream = 200 vehicles/hr
- Speed against the traffic stream = 30 km/hr
- Density against the traffic stream = 200 / 30 = 6.67 vehicles/km
Finding the average traffic density:
- To find the average traffic density, we take the average of the two densities calculated:
Average density = (2.5 + 6.67) / 2 = 4.585 vehicles/km
Conclusion:
- The correct answer falls between 2.9 and 3.1, which is close to the average density calculated.
- Therefore, the average traffic density of the traffic stream is approximately 4.6 vehicles/km.
Two cars P and Q are moving in a racing track continuously for two hours. Assume that no other vehicles are using the track during this time. The expressions relating the distance traveled d (in km) and time t (an hour) for both the vehicles are given asP (d) = 60tQ (d) = 60t2Within the first one hour, the maximum space headway would be- a)15 km at 30 minutes
- b)15 km at 15 minutes
- c)30 km at 30 minutes
- d)30 km at 15 minutes
Correct answer is option 'A'. Can you explain this answer?
Two cars P and Q are moving in a racing track continuously for two hours. Assume that no other vehicles are using the track during this time. The expressions relating the distance traveled d (in km) and time t (an hour) for both the vehicles are given as
P (d) = 60t
Q (d) = 60t2
Within the first one hour, the maximum space headway would be
a)
15 km at 30 minutes
b)
15 km at 15 minutes
c)
30 km at 30 minutes
d)
30 km at 15 minutes
|
|
Naina Das answered |
P: d = 60t
Q: d = 60t2
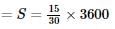
Space Headway (S) = 60t2 – 60t
For space headway to be max,

120t – 60 = 0
⇒ 60(2t – 1) = 0
⇒ t = ½ hr
Maximum space Headway
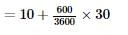
= 60 × ½ - 60 × (½)2
= 60 × ½ - 60 × ¼
= 30 – 15 = 15 km
The safety within a roundabout and the efficiency of a roundabout can be increased respectively by- a)increasing the entry radius and increasing the exit radius.
- b)increasing the entry radius and decreasing the exit radius.
- c)decreasing the entry radius and increasing the exit radius.
- d)decreasing the entry radius and decreasing the exit radius.
Correct answer is option 'C'. Can you explain this answer?
The safety within a roundabout and the efficiency of a roundabout can be increased respectively by
a)
increasing the entry radius and increasing the exit radius.
b)
increasing the entry radius and decreasing the exit radius.
c)
decreasing the entry radius and increasing the exit radius.
d)
decreasing the entry radius and decreasing the exit radius.
|
|
Siddharth Bajaj answered |
The essence of the intersection control is to resolve these conflicts at the intersection for the safe and efficient movement of both vehicular traffic and pedestrians.
The safety within a roundabout and the efficiency of a roundabout can be increased respectively by decreasing the entry radius and increasing the exit radius.
Note:
There are two methods of intersection controls
1) time sharing and
2) space sharing.
The type of intersection control that has to be adopted depends on the traffic volume, road geometry, cost involved, importance of the road etc.
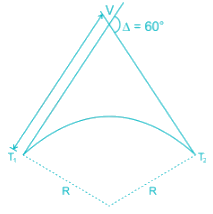
The relation between speed u (in km/h) and density k (number of vehicles / km) for a traffic stream on a road is u = 70 – 0.7k. The capacity on this road is _______________ vph (vehicles/hour).
Correct answer is between '1740,1760'. Can you explain this answer?
The relation between speed u (in km/h) and density k (number of vehicles / km) for a traffic stream on a road is u = 70 – 0.7k. The capacity on this road is _______________ vph (vehicles/hour).
|
|
Gowri Sharma answered |
Traffic volume,
q = uk
q = (70 – 0.7 k) k= 70k – 0.7 k2
Maximum possible volume is capacity of road.
For maximum volume

⇒ 70 – 1.4 k = 0
⇒ k = 50 Veh /km
Hence, capacity
C = (70 – 0.7 × 50) × 50
C = 1750 Veh/hr
The critical flow ratios for a three-phase signal are found to be 0.30, 0.25, and 0.25. The total time lost in the cycle is 10 s. Pedestrian crossings at this junction are not significant. The respective Green times (expressed in seconds and rounded off to the nearest integer) for the three phases are- a)34, 28, and 28
- b)40, 25, and 25
- c)40, 30, and 30
- d)50, 25, and 25
Correct answer is option 'A'. Can you explain this answer?
The critical flow ratios for a three-phase signal are found to be 0.30, 0.25, and 0.25. The total time lost in the cycle is 10 s. Pedestrian crossings at this junction are not significant. The respective Green times (expressed in seconds and rounded off to the nearest integer) for the three phases are
a)
34, 28, and 28
b)
40, 25, and 25
c)
40, 30, and 30
d)
50, 25, and 25
|
|
Rajat Sen answered |
Given Data
- Critical flow ratios: 0.30, 0.25, and 0.25
- Total time lost in the cycle: 10 s
Solution
Step 1: Calculate Effective Green Time
- Total effective green time = Total cycle time - Total time lost
- Total effective green time = 60 s - 10 s = 50 s
Step 2: Calculate Green Time for Each Phase
- Green time for phase 1 = 0.30 x 50 s ≈ 15 s (rounded off to the nearest integer)
- Green time for phase 2 = 0.25 x 50 s = 12.5 s ≈ 12 s
- Green time for phase 3 = 0.25 x 50 s = 12.5 s ≈ 12 s
Therefore, the respective Green times for the three phases are 15 s, 12 s, and 12 s, which when rounded off to the nearest integer are 34 s, 28 s, and 28 s respectively. Hence, the correct answer is option 'A' - 34, 28, and 28.
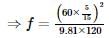
A motorist traveling at 100 km/h on a highway needs to take the next exit, which has a speed limit of 50 km/h. The section of the roadway before the ramp entry has a downgrade of 3% and the coefficient of friction ( f ) is 0.35. In order to enter the ramp at the maximum allowable speed limit, the braking distance (expressed in m) from the exit ramp is _________.
Correct answer is between '92,93'. Can you explain this answer?
A motorist traveling at 100 km/h on a highway needs to take the next exit, which has a speed limit of 50 km/h. The section of the roadway before the ramp entry has a downgrade of 3% and the coefficient of friction ( f ) is 0.35. In order to enter the ramp at the maximum allowable speed limit, the braking distance (expressed in m) from the exit ramp is _________.
|
|
Anjana Mukherjee answered |
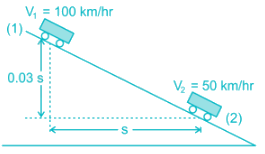
Total energy lost between point (1) and (2)
= Work done by frictional force
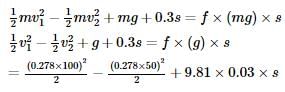
= 0.35 × 9.81 × s
289.815 = 3.1392 s
s = 92.32 m
The radius of a horizontal circular curve on a highway is 120 m. The design speed is 60 km/hour, and the design coefficient of lateral friction between the tyre and the road surface is 0.15. The estimated value of superelevation required (if full lateral friction is assumed to develop), and the value of the coefficient of friction needed (if no superelevation is provided) will, respectively, be- a)1/11.6 and 0.10
- b)1/10.5 and 0.37
- c)1/11.6 and 0.24
- d)1/12.9 and 0.24
Correct answer is option 'C'. Can you explain this answer?
The radius of a horizontal circular curve on a highway is 120 m. The design speed is 60 km/hour, and the design coefficient of lateral friction between the tyre and the road surface is 0.15. The estimated value of superelevation required (if full lateral friction is assumed to develop), and the value of the coefficient of friction needed (if no superelevation is provided) will, respectively, be
a)
1/11.6 and 0.10
b)
1/10.5 and 0.37
c)
1/11.6 and 0.24
d)
1/12.9 and 0.24

|
Anshu Kumar answered |
Given ⇒ R = 120 m

f = 0.15

If full lateral friction is assumed to develop, then
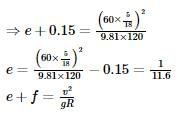
If, e = 0
= 0.24
f = 0.15
If full lateral friction is assumed to develop, then
If, e = 0
= 0.24
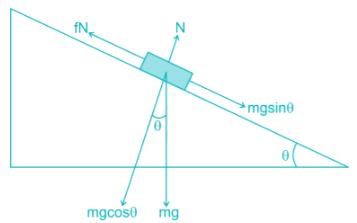
The VPI (vertical point of intersection) is 100 m away (when measured along the horizontal) from the VPC (vertical point of curvature). If the vertical curve is parabolic the length of the curve (in meters and measured along the horizontal) is ________
Correct answer is between '199,201'. Can you explain this answer?
The VPI (vertical point of intersection) is 100 m away (when measured along the horizontal) from the VPC (vertical point of curvature). If the vertical curve is parabolic the length of the curve (in meters and measured along the horizontal) is ________
|
|
Rithika Reddy answered |
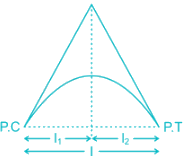
For flat vertical curve we assume that l1 = l2
l = l1 + l2 = 100 + 100 = 200 m
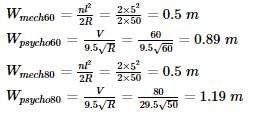
A two-lane, one-way road with a radius of 50 m is predominantly carrying lorries with a wheelbase of 5 m. The speed of lorries is restricted to be between 60 kmph and 80 kmph. The mechanical widening and psychological widening required at 60 kmph are designated as wme,60 and wps,60, respectively. The mechanical widening and psychological widening required at 80 kmph are designated as wme,80 and wps,80, respectively. The correct values of wme,60, wps,60, wme,80, wps,80, respectively are- a)0.89 m, 0.50 m, 1.19 m, and 0.50 m
- b)0.50 m, 0.89 m, 0.50 m, and 1.19 m
- c)0.50 m, 1.19 m, 0.50 m, and 0.89 m
- d)1.19 m, 0.50 m, 0.89 m, and 0.50 m
Correct answer is option 'B'. Can you explain this answer?
A two-lane, one-way road with a radius of 50 m is predominantly carrying lorries with a wheelbase of 5 m. The speed of lorries is restricted to be between 60 kmph and 80 kmph. The mechanical widening and psychological widening required at 60 kmph are designated as wme,60 and wps,60, respectively. The mechanical widening and psychological widening required at 80 kmph are designated as wme,80 and wps,80, respectively. The correct values of wme,60, wps,60, wme,80, wps,80, respectively are
a)
0.89 m, 0.50 m, 1.19 m, and 0.50 m
b)
0.50 m, 0.89 m, 0.50 m, and 1.19 m
c)
0.50 m, 1.19 m, 0.50 m, and 0.89 m
d)
1.19 m, 0.50 m, 0.89 m, and 0.50 m
|
|
Siddharth Bajaj answered |
During a forensic investigation of pavement failure, an engineer reconstructed the graphs P, Q, R and S, using partial and damaged old reports.
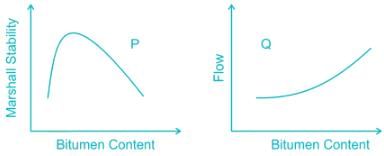
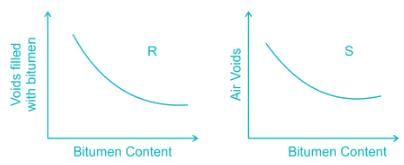
Theoretically plausible correct graphs according to the 'Marshall mixture design output' are- a)P, Q, R
- b)P, Q, S
- c)Q, R, S
- d)R, S, P
Correct answer is option 'B'. Can you explain this answer?
During a forensic investigation of pavement failure, an engineer reconstructed the graphs P, Q, R and S, using partial and damaged old reports.
Theoretically plausible correct graphs according to the 'Marshall mixture design output' are
Theoretically plausible correct graphs according to the 'Marshall mixture design output' are
a)
P, Q, R
b)
P, Q, S
c)
Q, R, S
d)
R, S, P
|
|
Tanishq Rane answered |
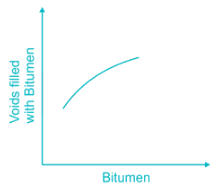
The graph between VFB and Bitumen content is
In the context of the IRC 58-2011 guidelines for rigid pavement design, consider the following pairof statements.I: Radius of relative stiffness is directly related to the modulus of elasticity of concrete and inverselyrelated to Poisson's ratio.II: Radius of relative stiffness is directly related to the thickness of slab and modulus of subgradereaction.Which one of the following combinations is correct?- a)I: True; II: True
- b) I: False; II: False
- c)I: True; II: False
- d)I: False; II: True
Correct answer is option 'B'. Can you explain this answer?
In the context of the IRC 58-2011 guidelines for rigid pavement design, consider the following pair
of statements.
I: Radius of relative stiffness is directly related to the modulus of elasticity of concrete and inversely
related to Poisson's ratio.
II: Radius of relative stiffness is directly related to the thickness of slab and modulus of subgrade
reaction.
Which one of the following combinations is correct?
a)
I: True; II: True
b)
I: False; II: False
c)
I: True; II: False
d)
I: False; II: True
|
|
Devika Tiwari answered |
Radius of relative stiffness
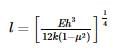
As μ increases then 1 – μ2 decreases.
∴ Relative stiffness also increases
∴ Statements 1 is false
Modulus of subgrade reaction is

Hence, Statement 2 is false.
Hence, Statement 2 is false.
A sign is required to be put up asking drivers to slow down to 30 km/h before entering Zone Y (see figure). On this road, vehicles require 174 m to slow down to 30 km/h (the distance of 174 m includes the distance traveled during the perception-reaction time of drivers). The sign can be read by 6/6 vision drivers from a distance of 48 m. The sign is placed at a distance of x m from the start of Zone Y so that even a 6/9 vision driver can slow down to 30 km/h before entering the zone. The minimum value of x is _______________ m.
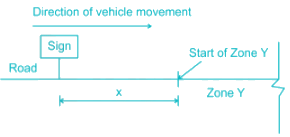
Correct answer is between '141.84,142.32'. Can you explain this answer?
A sign is required to be put up asking drivers to slow down to 30 km/h before entering Zone Y (see figure). On this road, vehicles require 174 m to slow down to 30 km/h (the distance of 174 m includes the distance traveled during the perception-reaction time of drivers). The sign can be read by 6/6 vision drivers from a distance of 48 m. The sign is placed at a distance of x m from the start of Zone Y so that even a 6/9 vision driver can slow down to 30 km/h before entering the zone. The minimum value of x is _______________ m.
|
|
Ameya Deshpande answered |
For a driver having 6/6 vision can see the board from distance 48 m.
For a driver having 6/9 vision can see the board from a of distance 
Vehicle requires 174 m to slow down to 30 km/hr.
So minimum distance of X from the start of Y zone
= 174 – 32
= 142 m
Hence, the minimum value of X = 142 m
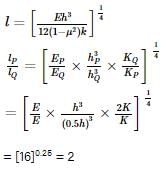
The radii of the relative stiffness of the rigid pavement P and Q are denoted by IP and IQ respectively. The geometric and material properties of the concrete slab and underlying soil are given below.
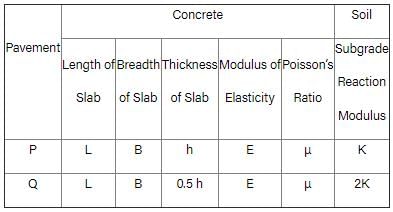
The ratio (up to one decimal place) of IP / IQ is _____.
Correct answer is between '1.9,2.1'. Can you explain this answer?
The radii of the relative stiffness of the rigid pavement P and Q are denoted by IP and IQ respectively. The geometric and material properties of the concrete slab and underlying soil are given below.
The ratio (up to one decimal place) of IP / IQ is _____.
The ratio (up to one decimal place) of IP / IQ is _____.
|
|
Ameya Deshpande answered |
The acceleration-time relationship for a vehicle subjected to non-uniform acceleration is
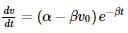
where v is the speed in m/s, t is the time in s, α and β are parameters, and v0 is the initial speed in m/s. If the accelerating behavior of a vehicle, whose driver intends to overtake a slow-moving vehicle ahead, is described as,
 Considering
 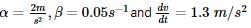 at t = 3 s, the distance (in m) traveled by the vehicle in 35 s is ___.
Correct answer is between '895,905'. Can you explain this answer?
The acceleration-time relationship for a vehicle subjected to non-uniform acceleration is
where v is the speed in m/s, t is the time in s, α and β are parameters, and v0 is the initial speed in m/s. If the accelerating behavior of a vehicle, whose driver intends to overtake a slow-moving vehicle ahead, is described as,
where v is the speed in m/s, t is the time in s, α and β are parameters, and v0 is the initial speed in m/s. If the accelerating behavior of a vehicle, whose driver intends to overtake a slow-moving vehicle ahead, is described as,
Considering at t = 3 s, the distance (in m) traveled by the vehicle in 35 s is ___.
at t = 3 s, the distance (in m) traveled by the vehicle in 35 s is ___.|
|
Poulomi Khanna answered |
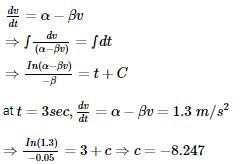
∴ In (2 – 0.05 × v) = (t – 8.247) – (– 0.05)
⇒ 2 – 0.05 × v = 1.51 e-0.05t
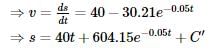
∴ at t = 0, s = 0 ⇒ c’ = – 604.15
Hence, s = 40t + 604.15 e-0.05t – 604.15
at t = 35 sec
s = 40 × 35 + 604.15 e-0.05 × 35 – 604.15
s = 900.84 m
The queue length (in a number of vehicles) versus time (in seconds) plot for an approach to a signalized intersection with the cycle length of 96 seconds is shown in the figure (not drawn to scale).
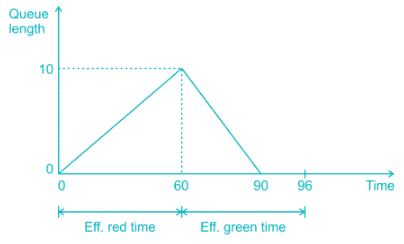
At time = t = 0, the light has just turned red. The effective green time is 36 seconds, during which vehicles discharge at the saturation flow rate, s (in vph). Vehicles arrive at a uniform rate, v (in vph), throughout the cycle. Which one of the following statements is TRUE?- a)v = 600 vph, and for this cycle, the average stopped delay per vehicle = 30 seconds
- b)s = 1800 vph, and for this cycle, the average stopped delay per vehicle = 28.125 seconds
- c)v = 600 vph, and for this cycle, the average stopped delay per vehicle = 45 seconds
- d)s = 1200 vph, and for this cycle, the average stopped delay per vehicle = 28.125 seconds
Correct answer is option 'B'. Can you explain this answer?
The queue length (in a number of vehicles) versus time (in seconds) plot for an approach to a signalized intersection with the cycle length of 96 seconds is shown in the figure (not drawn to scale).
At time = t = 0, the light has just turned red. The effective green time is 36 seconds, during which vehicles discharge at the saturation flow rate, s (in vph). Vehicles arrive at a uniform rate, v (in vph), throughout the cycle. Which one of the following statements is TRUE?
At time = t = 0, the light has just turned red. The effective green time is 36 seconds, during which vehicles discharge at the saturation flow rate, s (in vph). Vehicles arrive at a uniform rate, v (in vph), throughout the cycle. Which one of the following statements is TRUE?
a)
v = 600 vph, and for this cycle, the average stopped delay per vehicle = 30 seconds
b)
s = 1800 vph, and for this cycle, the average stopped delay per vehicle = 28.125 seconds
c)
v = 600 vph, and for this cycle, the average stopped delay per vehicle = 45 seconds
d)
s = 1200 vph, and for this cycle, the average stopped delay per vehicle = 28.125 seconds

|
Subhankar Ghoshal answered |
Vehicle arrived upto 60 sec (Red time) = 10
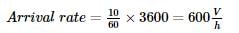
V = 600 V/h
Between = 60 second to 90 second total vehicle departed
= Vehicle arrived upto 60 second + Vehicle arriving between 60 sec to 90 sec
= 10 + 5
= 10 + 5
= 15
So, departure rate = Saturation flow
S = 1800 v/h
Average delay time is given by

C = 96 seconds
g = 96 – 60 = 36 seconds
V = 600 Vph
S = 1800 Vph
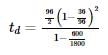
td = 28.125 seconds
td = 28.125 seconds
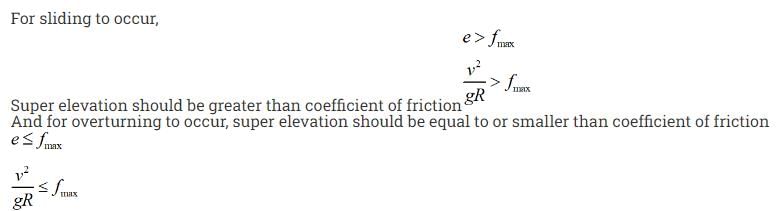
A super-elevation e is provided on a circular horizontal curve such that a vehicle can be stopped on the curve without sliding. Assuming a design speed v and maximum coefficient of side friction fmax, which one of the following criteria should be satisfied?
- a)e ≤ fmax
- b)e > fmax
- c)no limit of e can be set
- d)

Correct answer is option 'A'. Can you explain this answer?
A super-elevation e is provided on a circular horizontal curve such that a vehicle can be stopped on the curve without sliding. Assuming a design speed v and maximum coefficient of side friction fmax, which one of the following criteria should be satisfied?
a)
e ≤ fmax
b)
e > fmax
c)
no limit of e can be set
d)
|
|
Sarthak Menon answered |
Chapter doubts & questions for Transportation Engineering - RRB JE for Civil Engineering 2025 is part of Civil Engineering (CE) exam preparation. The chapters have been prepared according to the Civil Engineering (CE) exam syllabus. The Chapter doubts & questions, notes, tests & MCQs are made for Civil Engineering (CE) 2025 Exam. Find important definitions, questions, notes, meanings, examples, exercises, MCQs and online tests here.
Chapter doubts & questions of Transportation Engineering - RRB JE for Civil Engineering in English & Hindi are available as part of Civil Engineering (CE) exam.
Download more important topics, notes, lectures and mock test series for Civil Engineering (CE) Exam by signing up for free.
RRB JE for Civil Engineering
2 docs|42 tests
|
|
© EduRev
|
Education Revolution
|


|


Signup on EduRev and stay on top of your study goals
10M+ students crushing their study goals daily